
July 28, 2026
DOWNLOAD PERSPECTIVE
Lyell Wealth Management invests substantial resources in proprietary research in order to distinguish real economic and market data from the narratives pushed by the advertising-driven financial media. We periodically publish a Snapshots issue that compiles charts and tables that we think are interesting and relevant. While there may not be a single unifying theme tying these charts together, the goal is to provide insight into what Lyell Wealth Management believes is relevant and insightful but perhaps not widely publicized.
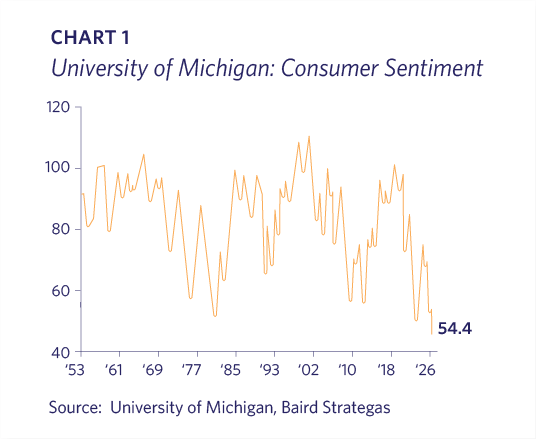
U.S. consumer sentiment is at 70-year lows, which indicates more about the survey quality, media, and politics than underlying economic realities. No one could seriously claim economic conditions are worse than any point in the last 70 years (Chart 1).
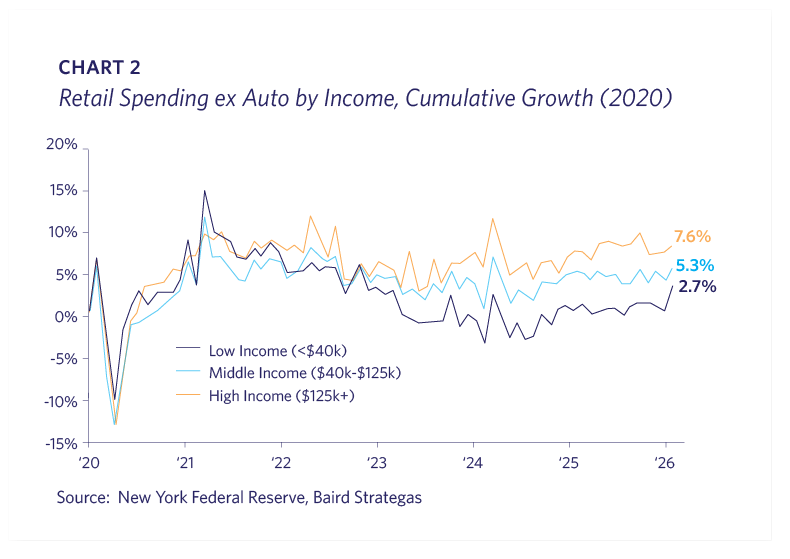
The economy can be better assessed by data such as retail spending, which indicates actual behavior rather than opinions. Although there has been much discussion in recent years about a “K-shaped economy,” with upper-income households thriving while lower-income consumers struggle, it is more insightful to consider an “E-shaped economy” by breaking out three income cohorts. Recent data shows even low-income households muddling through (Chart 2).
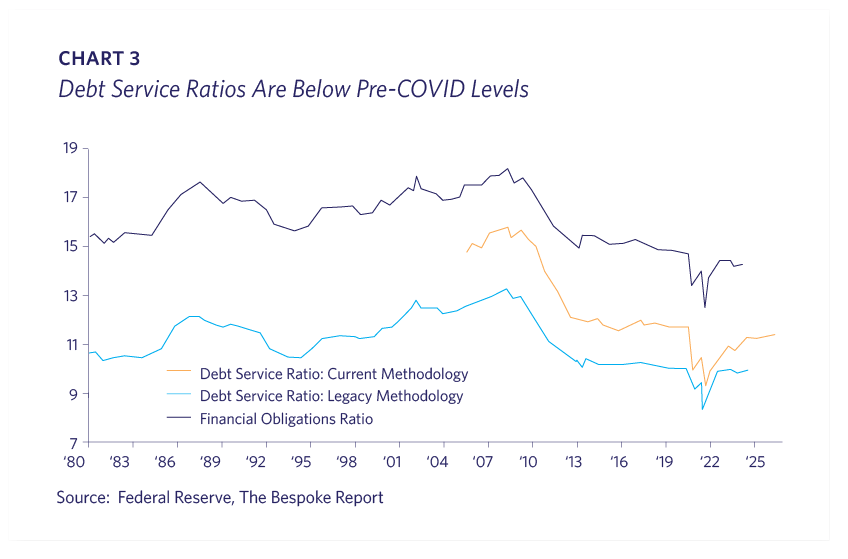
Consumer debt service ratios are below pre-Covid levels, and substantially lower than their pre-Global Financial Crisis (“GFC”) peak (Chart 3).
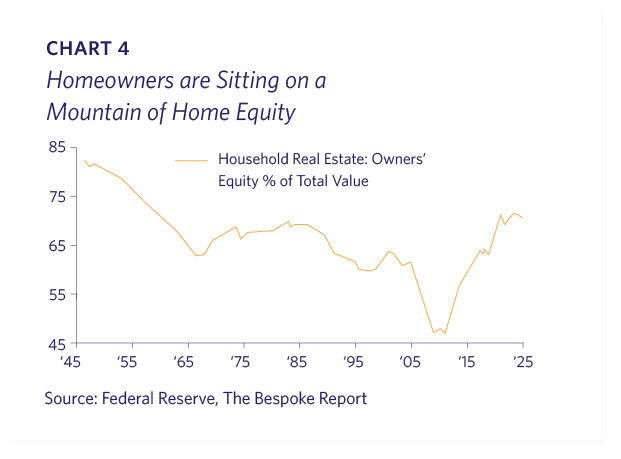
Meanwhile, there is plenty of net worth in residential real estate as, in aggregate, homeowners have ~70% equity in their properties (Chart 4).
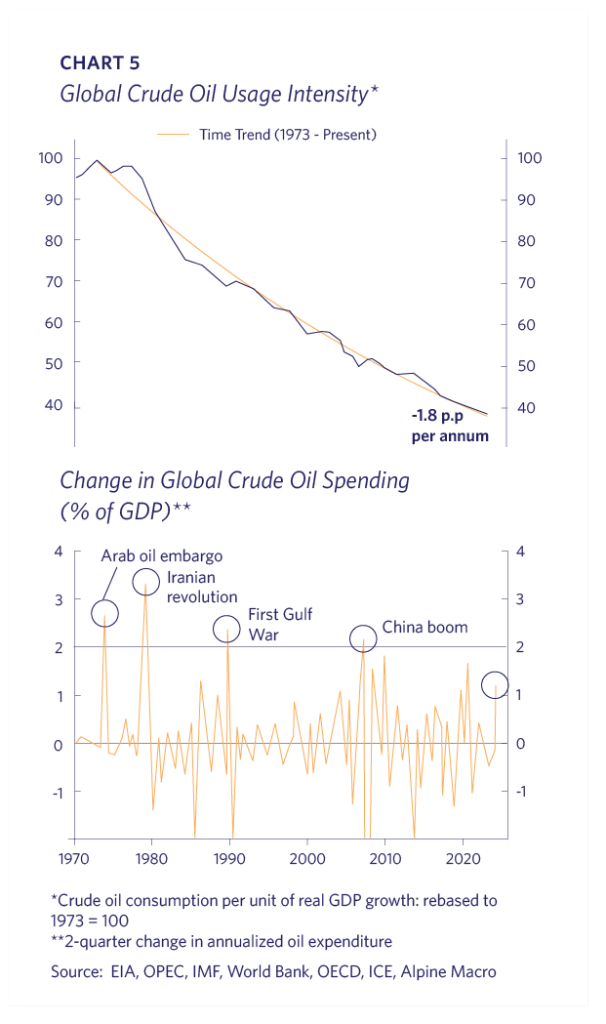
Thus far, the limited market fallout from the Iran conflict and subsequent Strait of Hormuz closing has confounded virtually every energy expert. One explanation is that, over the last five decades, there has been a steady decrease in global energy usage intensity. This is due to greater efficiencies as well as non-energy-intensive industries’ growing in economic importance. Each energy shock over the past fifty years has resulted in smaller impacts as a percentage of global GDP (Chart 5).
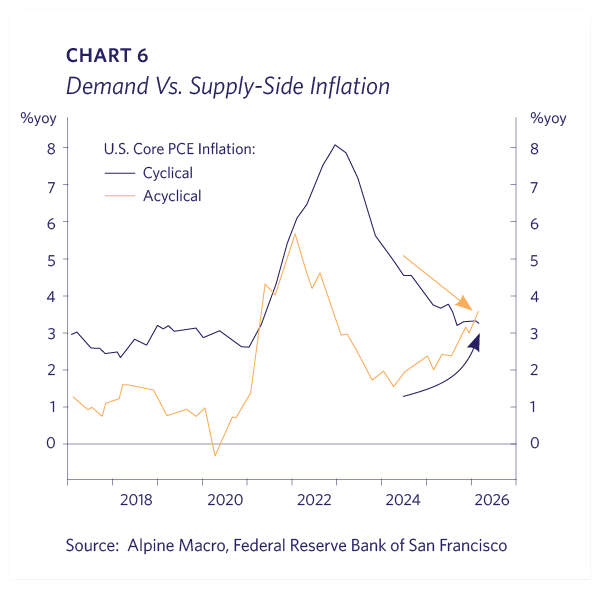
Other than a further spike in oil prices and commensurate increase in bond yields, the most likely foreseeable risk to the stock market is a Federal Reserve tightening. The market has priced in 1-2 increases for 2026, although Lyell believes that none is most likely. The argument against tightening is that today’s higher inflation is “acyclical,” meaning that price increases are driven by factors such as regulatory changes, supply-chain bottlenecks, or forces largely insensitive to monetary policy (Chart 6).
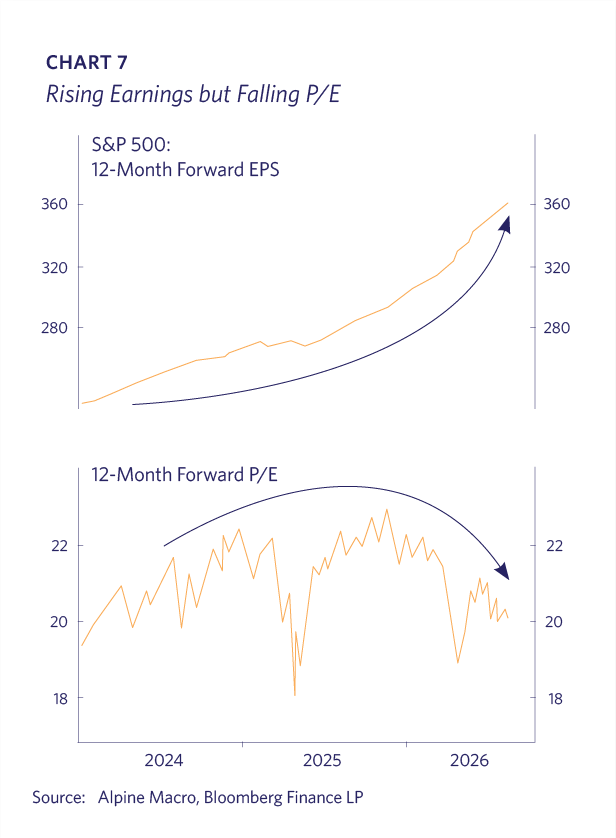
The geopolitical and energy uncertainty hasn’t adversely impacted corporate America so far. S&P 500 forward earnings expectations have more than matched the rising stock market, while price/earnings ratios have declined (Chart 7).
S&P 500 earnings growth expectations have almost doubled from January to June, while sales growth expectations have risen over 60%. Although the Artificial Intelligence (“AI”) build-out is the primary economic and market driver, growth is broad-based. Of the eleven industry sectors within the S&P 500, earnings expectations have increased for nine and sales growth expectations for ten (Table 1).

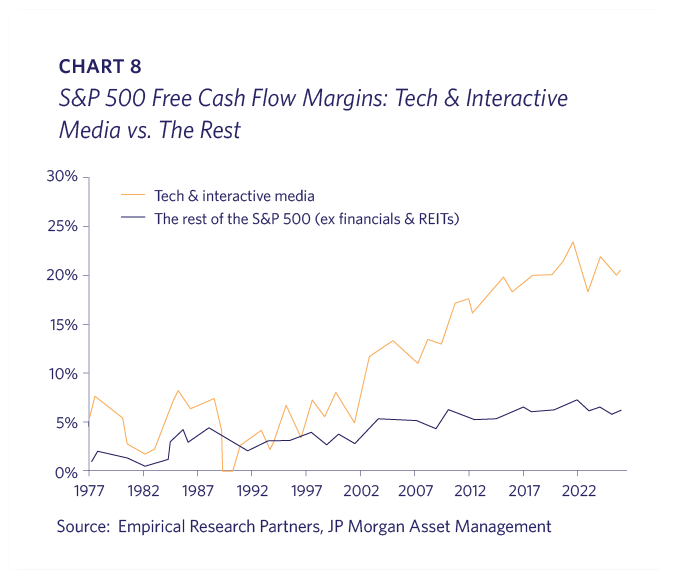
For many years, market commentators have observed that U.S. stocks have higher valuations than their overseas counterparts. Much can be explained by comparing the free cash flow margins of U.S. tech and interactive media companies versus the rest of the S&P 500, non-US markets and the distant past (Chart 8).
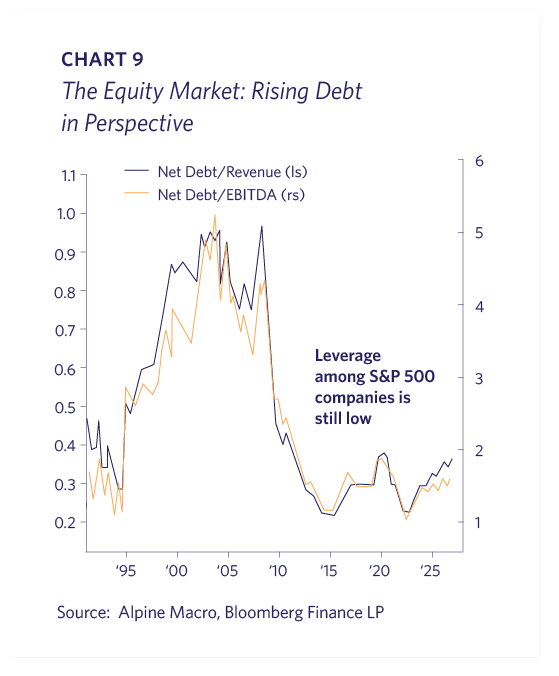
S&P 500 companies are much less leveraged than their pre-GFC predecessors. This is another factor in the improvement we have seen in financial metrics over time (Chart 9).
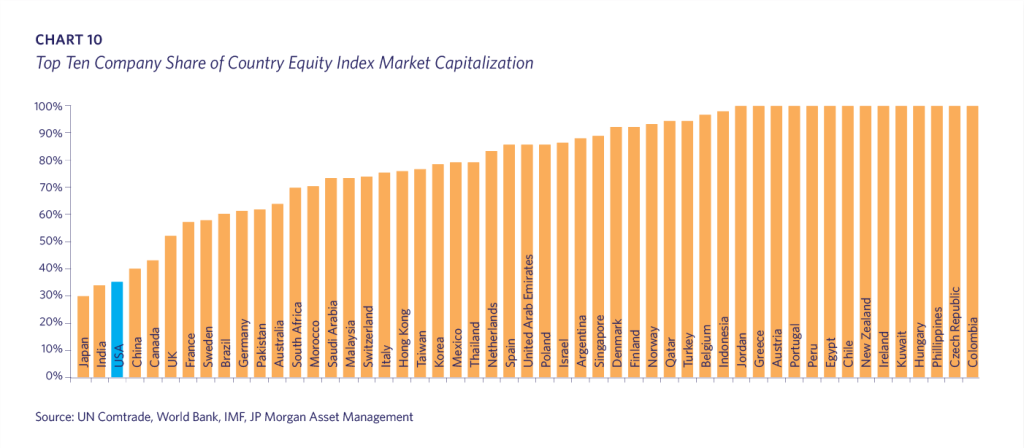
There has been frequent concern about how the largest ten companies represent almost 40% of the S&P 500 index. It is never mentioned that the U.S. has the third lowest equity market concentration in the world with only Japan and India having their top ten represent a smaller percentage (Chart 10).
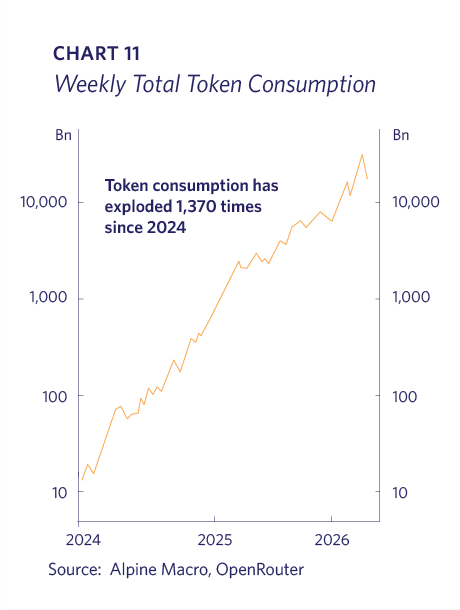
We are in the midst of an AI super-cycle with explosive usage and corresponding investment. A “token” is an AI unit of text that an AI model processes, and it therefore directly indicates usage. Weekly token consumption has increased by a factor of 1370x since 2024 (Chart 11).
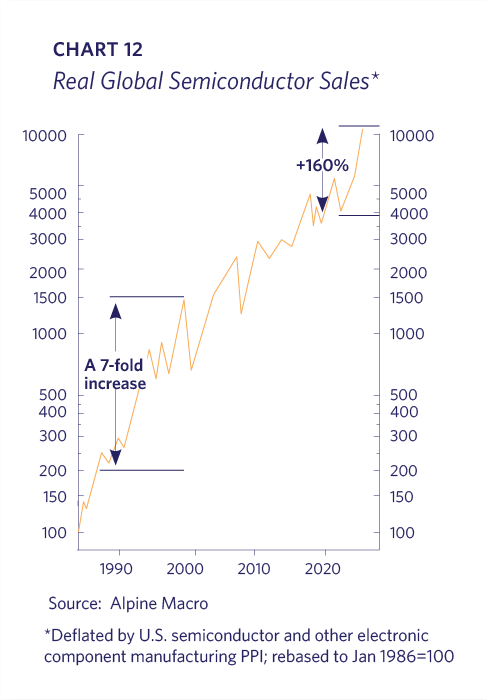
The demand for semiconductors for the AI build-out has been insatiable. Global semiconductor sales have increased by over 160% since ChatGPT’s unveiling. It is worth noting that semiconductor sales increased by 7x during the 1990s (Chart 12).
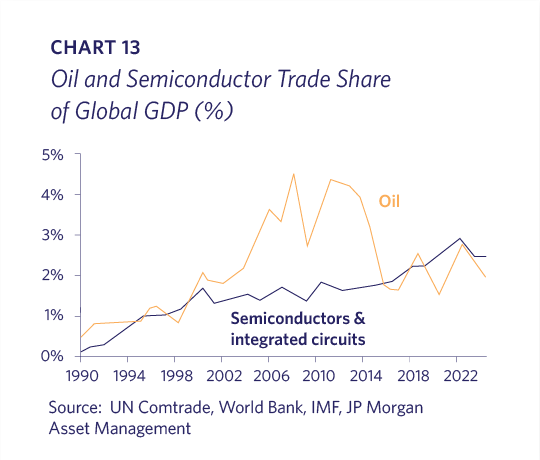
Semiconductors are an increasingly critical component of the economy and recently surpassed oil in terms of their share of global trade. As the world becomes increasingly digital, this will inevitably continue (Chart 13).
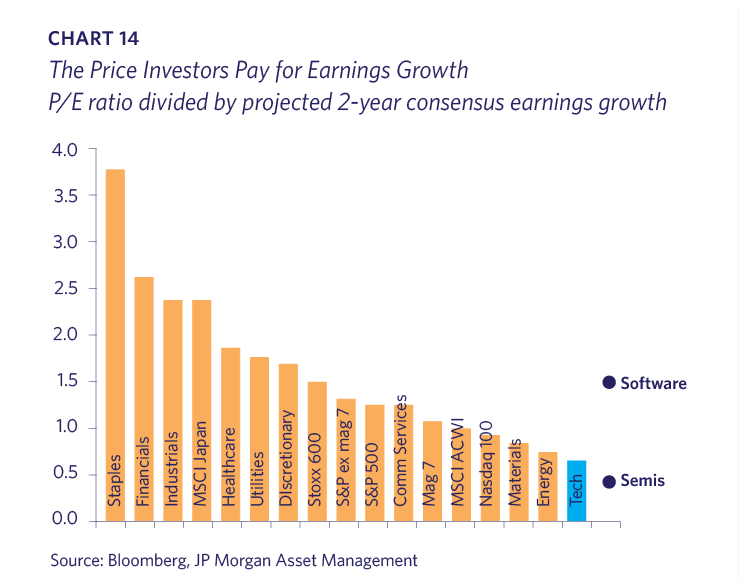
Some investors are concerned that stocks exposed to the AI buildout are pricing in too many years of continued strong growth, creating the potential for future disappointment. Tech stocks – and semiconductors in particular – are priced much more conservatively relative to their projected earnings than any other sector (Chart 14).
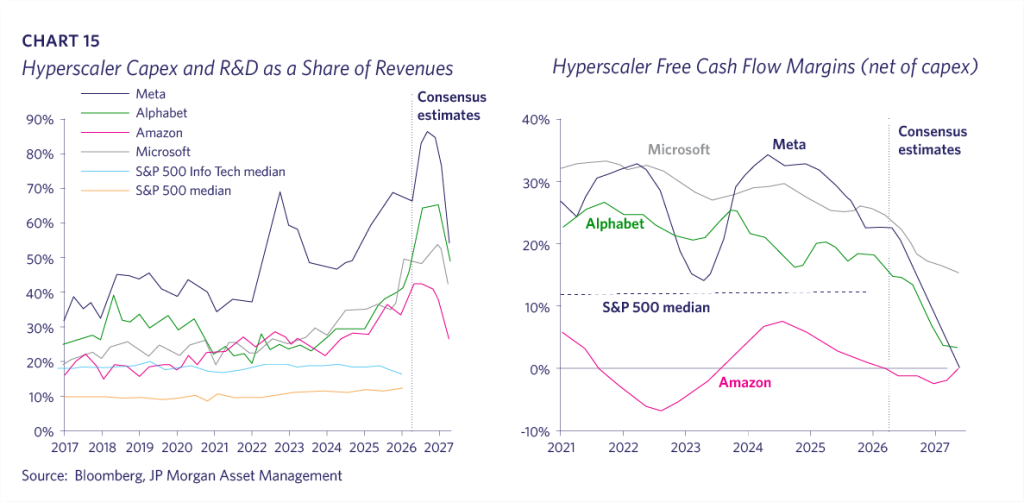
The market is discounting future growth because the massive size of capex investments appears unsustainable. The leading tech companies, which have been the greatest free cash flow machines in history, are plowing their cash flow and more into their AI infrastructure. They are issuing debt and even equity in some instances to cement themselves as leaders in the next economic chapter. There is a limit to which they can continue to increase investment, which is why the analysts are forecasting capex rolling over in the near future (Chart 15).
The incumbents’ ambition and desperation reflect their recognition that paradigm shifts of this magnitude often lead to major changes in market leadership. Although the following chart focuses only on the software market, it compares today’s landscape with those of prior eras. Note that today’s AI chart includes some private companies whose valuations exceed some publicly traded ones (Chart 16).

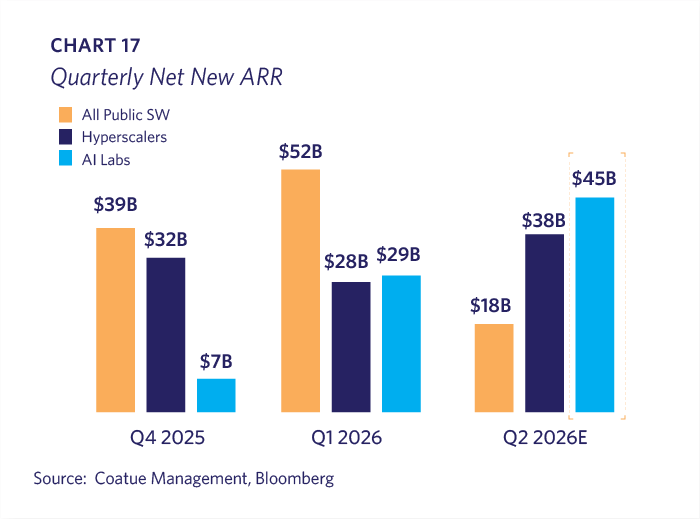
One sign that a handoff may be underway is the relative growth in net new Annual Recurring Revenue (“ARR”), a key measure of software company health. Over the past three quarters, net new ARR has surged at the AI labs, while the hyperscalers ñ including Google, Microsoft, and AWS ñ have continued to post strong growth. There is great concern about the trajectory of many established software companies, most of which now face the burden of disproving the prevailing negative narrative that AI threatens their business and/or revenue models (Chart 17).
SpaceX completed a historic IPO in June at a valuation of approximately $1.8 trillion. The company operated privately for 24 years before going public, serving as a poster child for the private markets’ ability to provide large amounts of capital, and for the wealth creation that public investors missed along the way. The well-intended Sarbanes-Oxley and Dodd-Frank Acts, enacted after the dot-com bust and GFC, respectively, have been major factors in companies remaining private longer (Table 2).

A market development that is causing Lyell Wealth Management discomfort is the growing gamification and use of leverage in the stock market. Although the market has some casino-like characteristics, prudent and patient investors can prosper over time by participating in the steady growth of the world’s greatest companies. Rapid trading, however, is likely to end badly for the vast majority of participants, particularly when debt is used to amplify both risk and potential returns. At that point, investing begins to resemble a casino, which is a negative sum game in which the house is the only consistent winner.
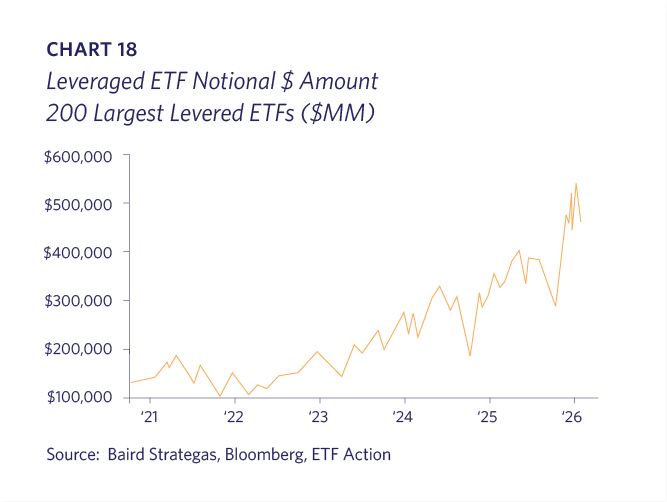
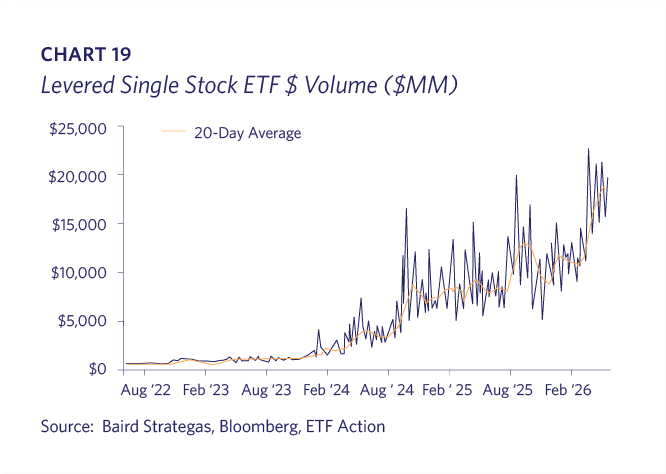
Leveraged ETFs have increased by 4.5x since June 2020 and now represent approximately $500 billion in notional exposure. Trading volume in single-stock leveraged ETFs has also exploded over the past two years (Charts 18 and 19).
As of June 28, 2026, leveraged ETFs represented over 17% of U.S. ETF trading volume. This leverage introduces greater volatility into the broader market as dealers and traders hedge and unwind positions. The opacity of these publicly listed strategies combined with leverage transacted privately, increases the risk of a market shock when enough participants are caught offside.
Single-stock leveraged ETFs recently accounted for as much as 60% of daily trading volume in South Korea, contributing to such volatility on July 7th that a 20-minute “circuit breaker” was invoked. It was the sixth circuit breaker of 2026; for context, there had been only twelve such events since 2000. The growing use of leveraged ETFs in the U.S., together with the expansion of “prediction market” futures, is not a positive development in our eyes.
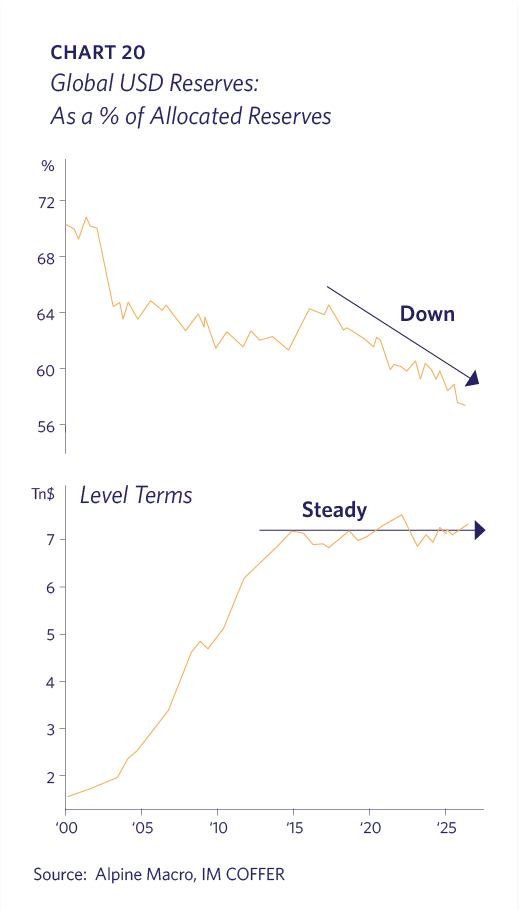
As Lyell’s May 2025 King Dollar Perspective pointed out, there is little evidence to support the claims than the U.S. is losing its preeminence as the issuer of the world’s primary reserve currency, or that non-U.S. investors are divesting from American assets. Although the percentage of foreign exchange reserves held in U.S. dollars has declined, the absolute amount has remained roughly level (Chart 20). The marginal shift has not moved to the euro, yen or Chinese RMB, but rather to a collection of smaller currencies, such as the Australian dollar and Brazilian real. Meanwhile, net foreign purchases of U.S. securities have increased by more than $1 trillion in recent years (Chart 21).

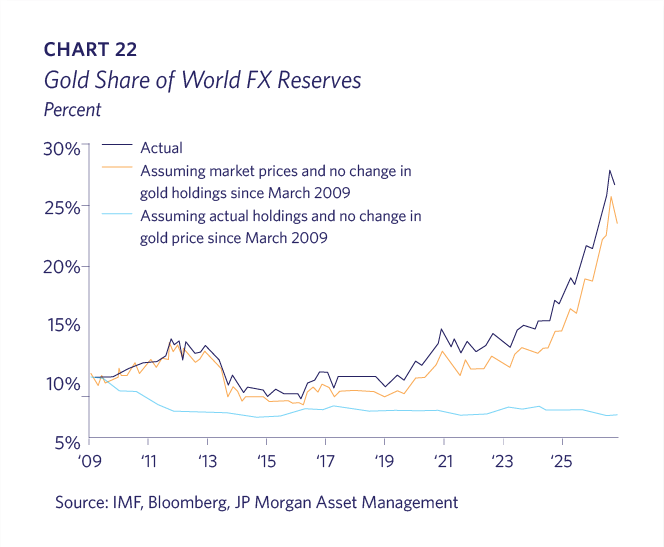
As part of the USD abandonment narrative, many reports of gold buying by foreign central banks have been overstated. These reports have conflated the appreciation in gold prices with the amount of gold actually purchased. Since 2009, when the price of gold is held constant, its share as a percentage of global FX reserves has declined (Chart 22).
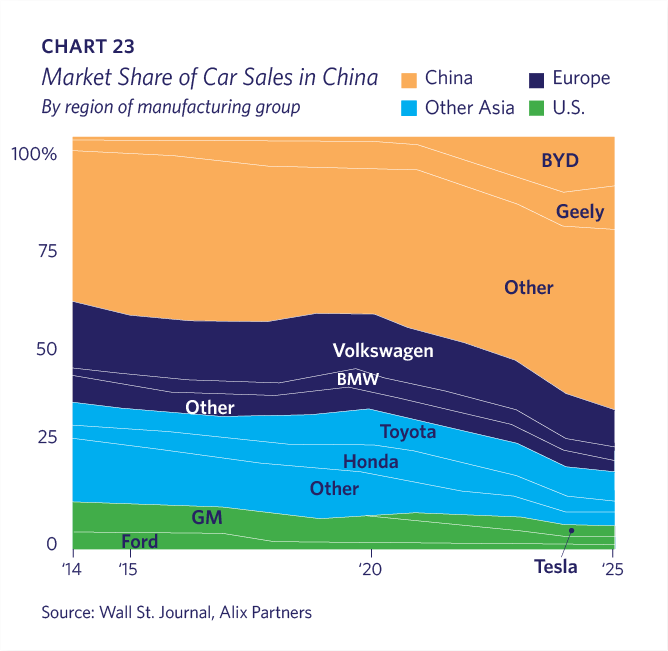
The promise of China as a huge and ravenous consumer market for Western companies is rapidly fading. When the Chinese economy first opened up, Western brands were highly desirable because they offered products that were otherwise unavailable or carried a sense of prestige. As China has developed across almost every industry, both the need for and interest in imports have greatly diminished. To make matters worse, China is now very competitive in most advanced industries and, as its domestic economy struggles, it is ramping up exports to the rest of the world. This has major global political implications. No industry better exemplifies this trend than automotive, where Chinese companies are increasingly dominating their domestic market and seeking to sell abroad (Chart 23).
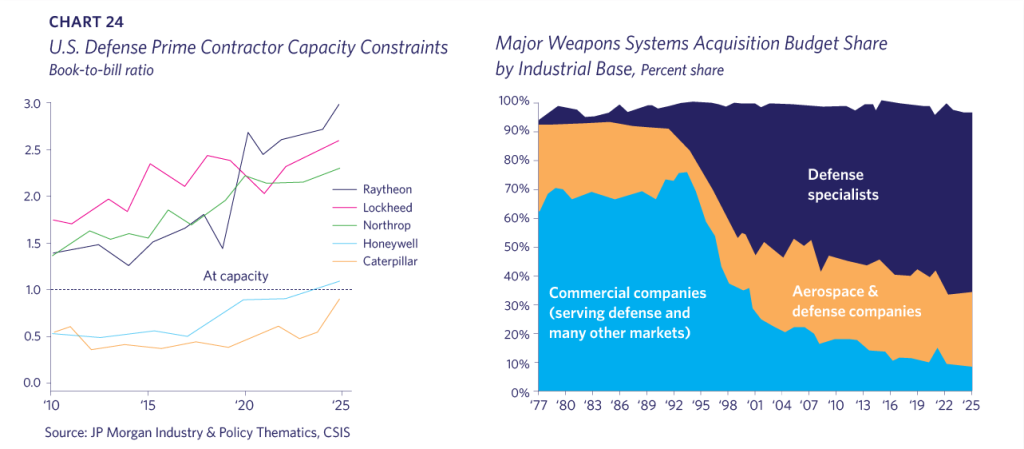
The Trump Administration has linked national security to economic security. One of its priorities is to increase domestic manufacturing so that the U.S. is better equipped to build military equipment. Ford Motor and General Motors are among the industrial companies exploring how their personnel, supply chains, and factory capacity can supplement traditional defense contractors who lack the capacity to handle the demand. It is worth remembering how much the defense industry restructured during the 1990s (Chart 24).
The U.S. stock market, particularly the areas most exposed to the AI buildout, ran up significantly through the end of June. Since then, we have seen an orderly consolidation, as the most extended stocks have retreated while those that lagged the earlier advance have begun to participate. Market breadth has actually improved during this “AI correction,” which we view as a sign of a strong and healthy market. Although surprises, and therefore volatility, are always possible, we believe the underlying economic and technological trends supporting the market remain firmly intact.