May 10, 2025
DOWNLOAD PERSPECTIVE
The Trump Administration’s aggressive trade and national security policies have fueled market volatility, leading some to question whether the U.S. is ceding its global financial leadership. There have been numerous media stories suggesting that investors are retreating from U.S. assets and the status of the U.S. dollar (“USD”) as the world’s primary reserve currency is imperiled. Given the U.S.’ $2 trillion annual fiscal deficit and huge pile of government debt, one should be vigilant to any shifts in this regard.
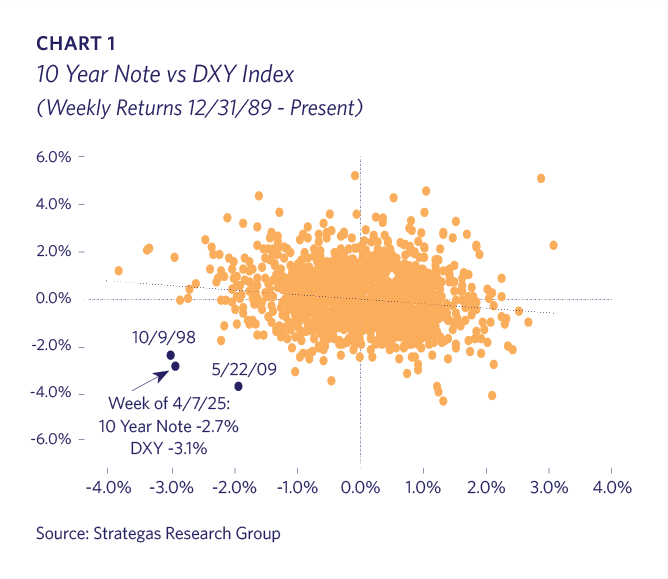
The 10 Year U.S. Treasury lost 2.7% in value during the week of April 7th after yields jumped from 4.01% to 4.47%. Meanwhile, the trade weighted USD declined 3.1% in the same week. A significant drop in the USD while the stock market and Treasury bonds are also falling is unusual for the world’s primary reserve currency. Typically, an economic shock that pummels stock prices would result in a “flight to quality” in which U.S. Treasury yields drop and the USD rises. The market behavior observed during the week of April 7th, following President Trump’s “Liberation Day” was reminiscent of an emerging market, not the world’s leading economy.
It is worth noting that since 1990 there have only been three weekly observations when the USD and Treasury prices both fell dramatically and simultaneously. The other two events occurred in October 1998 and May 2009. October 1998 was following the notorious failure of hedge fund Long-Term Capital Management (“LTCM”), and May 2009 was near the end of the Global Financial Crisis when the U.S. AAA bond rating came into question following the United Kingdom’s downgrade (Chart 1).
The price action for U.S. Treasuries was certainly volatile in early April, with elevated concerns about trade, tariffs and investor auction demand (Chart 2).

Longer-term charts provide better perspective, and the 10-year Treasury yield’s trading range throughout April was near the midpoint for the past two years and not indicative of significant distress (Chart 3).

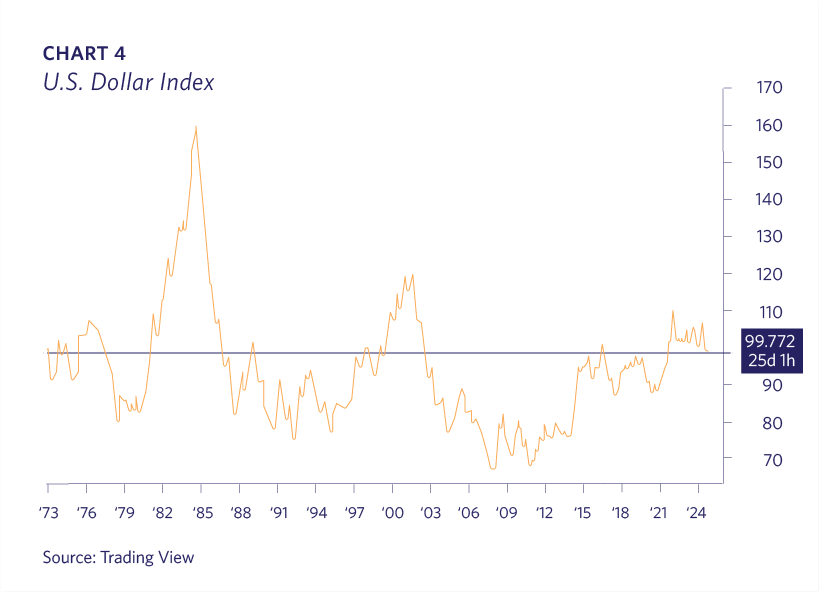
Stepping back, the USD’s trading level has varied significantly since President Nixon unpegged the dollar from the price of gold in 1973. The USD has appreciated considerably over the past dozen years and at current levels cannot be considered “weak” (Chart 4).
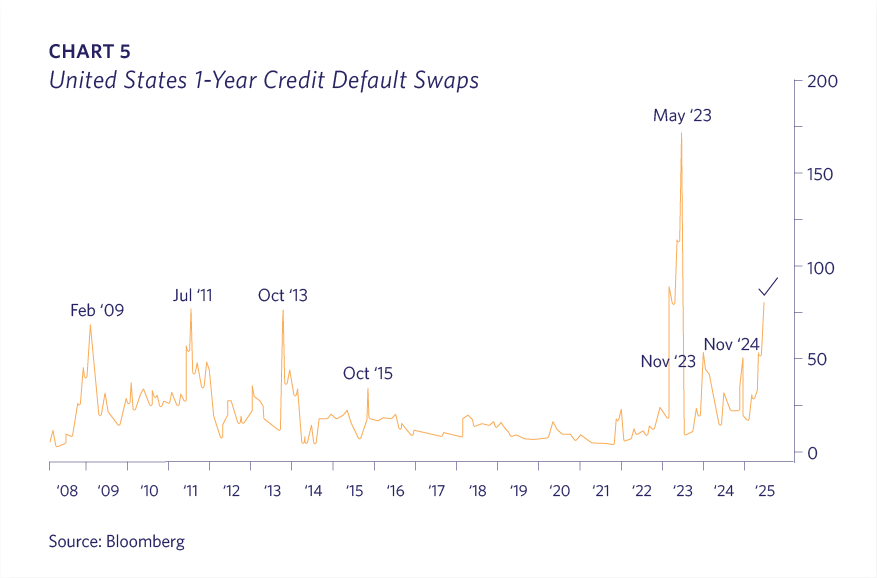
Credit default swaps (CDS) on U.S. sovereign debt surged amid the market turmoil but remained well below levels seen during the 2023 debt ceiling crisis (Chart 5). It should be noted that the market for U.S. government CDS is very small and illiquid and therefore susceptible to large price movements.
If the unusual price activity didn’t reflect the U.S. losing its financial primacy, then why the rare correlation? As is often the case, market positioning is the likely explanation. President Trump’s exceedingly large tariff announcement on April 2 caught many institutional investors offsides and needing to unwind their positions. There is a strategy in the murky world of macro-hedge funds that seeks to take advantage of tiny differences in prices between U.S. Treasury bonds and derivatives contracts linked to them. These hedge funds employ highly leveraged strategies and borrow extreme amounts of money transforming small profits into large ones. This is very similar to the “basis trade” strategy used by LTCM that caused a financial market crisis and subsequent bailout in 1998; a LTCM trader at the time complained that “we’d just experienced three ‘one in a million’ days in the past week” when reality didn’t jibe with its quantitative models. Hedge funds have built up progressively larger derivative positions involving these types of U.S. Treasury spread strategies over the past decade, dwarfing those of LTCM (Chart 6).

Cross-currency trades, when global investors borrow in one currency and invest in another, can create another source of volatility. A long-time strategy by some global investors has been the “yen-carry” trade whereby investors borrow in the Japanese currency, convert Yen to USD, and invest in the U.S. market. The brief August 2024 U.S. stock market tumult was attributed to unwinding some of these trades when the Japanese yen exhibited surprising strength. In the past week the Taiwan dollar appreciated 9% in two days as Taiwanese life insurance companies hedged their previously unhedged $1 trillion fixed income portfolios. The key takeaway is that large investment flows can trigger volatility when highly leveraged investors are caught on the wrong side of the market. Unwinding these positions exacerbates price movements, and, without external intervention, it generally takes some time before equilibrium is reached .
It should not be a surprise that the most extreme market reaction occurred at the U.S. market open on Monday, April 7th. Excessively indebted investors had been notified by their broker-dealers over the weekend to liquidate positions and did so regardless of price. In the process of forced large selling, typical trading relationships between currencies and rates can be disrupted and not necessarily indicate any fundamental logic.
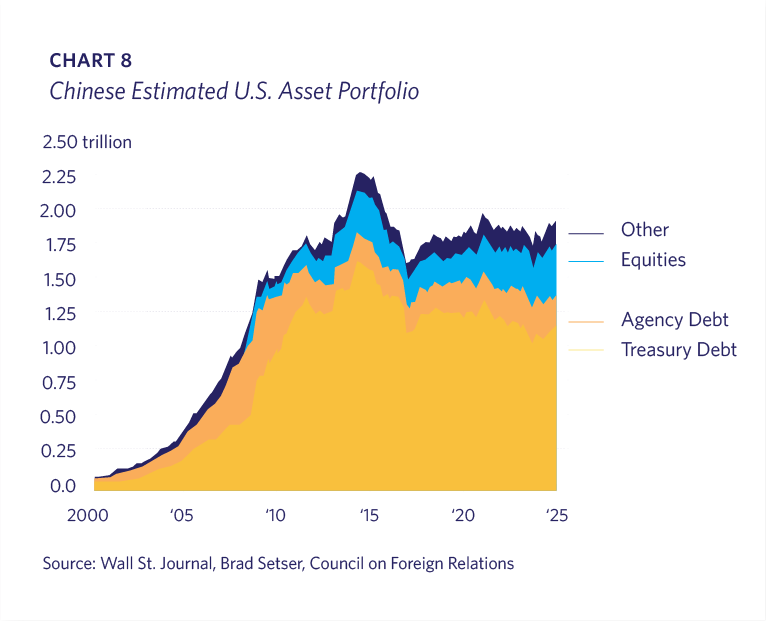
One narrative is that non-U.S. investors are selling U.S. Treasuries. Foreign ownership of U.S. government debt has been declining since 2009, primarily as global investors have let debt mature and reinvested elsewhere (Chart 7). China’s investment in U.S. assets has been stagnant to declining for many years (Chart 8).

Although the United States is experiencing significant political turmoil and economic challenges, the issues confronting other major countries are equally or perhaps more difficult. Europe is dealing with some of the same issues as the U.S. (immigration, populism), but has the additional burdens of higher regulation and energy prices with less innovation and fiscal cohesion. Its union is more fragile as each country remains distinct and populist movements continue to threaten the very existence of the European Union. Japan has a well-known aging demographic problem and exceedingly high government debt levels. China lacks currency convertibility and has a questionable belief in the rule of law. One must remember that institutional investors must choose a currency and an asset to hold. It is always a relative choice, and the U.S. remains the largest, most liquid and transparent capital market in the world.
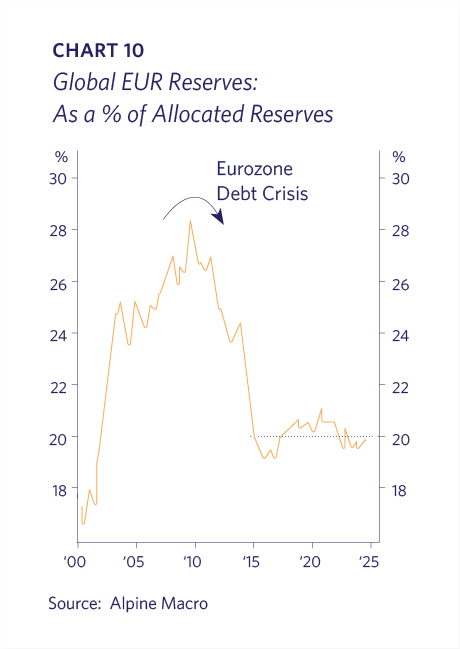
Although there is certainly the possibility that global investors will decrease their USD investments, changes will likely be marginal. The USD’s share of global foreign exchange (“FX”) reserves has been slowly declining for 25 years (Chart 9). Likewise, the Euro’s share of global FX reserves has been declining for the past 15 years (Chart 10). Despite expectations for the Chinese Yuan to emerge as a reserve currency, its share is actually declining (Chart 11).


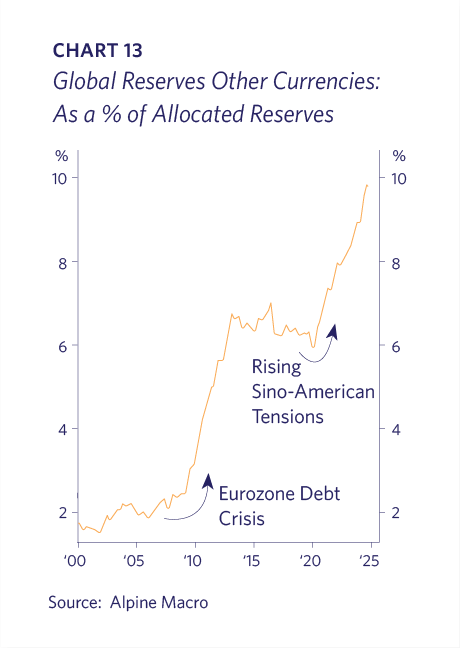
The major fiat currencies showing an increase in allocated FX reserves in recent years are the Japanese Yen, British Pound, and Swiss Franc, although in total they command only 11% of the total (Chart 12). The net winner of increased FX reserves is “the field” (i.e. Australia, Canada, Brazil, etc.), having picked up 8% of global share in the past 15 years (Chart 13).

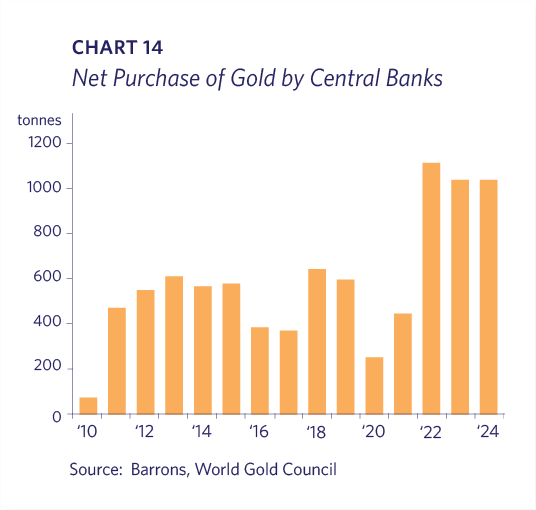
The freezing of Russia’s FX reserves following its 2022 Ukraine invasion has led to increased gold purchases by central banks as an alternative to fiat currencies that can be frozen or seized in the banking system (Chart 14). Although it is likely that India and China, as well as other countries such as Saudi Arabia and Turkey, will add to their holdings, gold is too small of a market to absorb a substantial allocation of global reserves. The same holds true for Bitcoin, which for some is viewed as a digital store-of-value. Bitcoin could conceivably gain some share, but its price volatility and illiquidity make it unlikely to gain any significant allocation in global FX reserves.
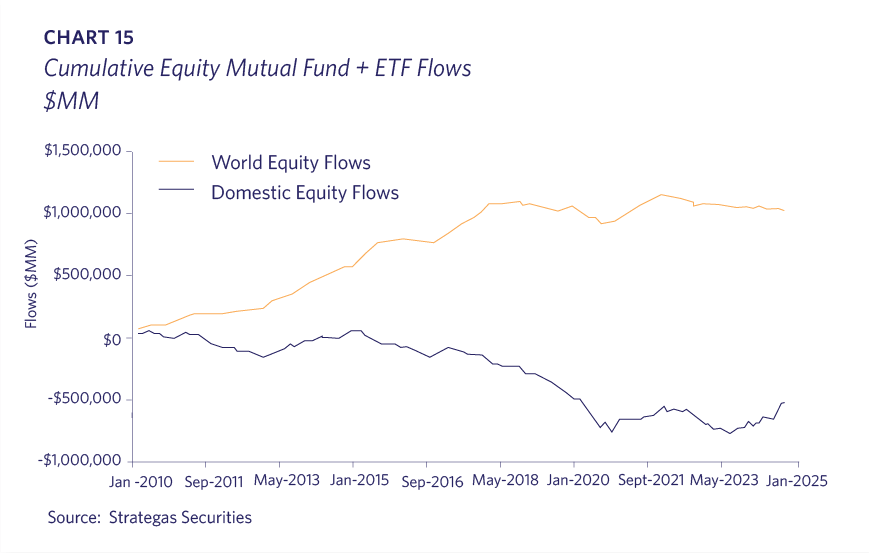
Throughout Lyell’s nine-year existence, many market pundits and investment firms have argued for a substantial allocation towards international stocks. We have frequently commented in our Perspectives and client letters that our investment focus on global leaders in attractive industries has made Lyell U.S.-centric. Over the past 15 years, the cumulative investment flows into non-U.S. equity mutual funds and ETFs have reached almost $1 trillion, while a net $500 billion has exited U.S. funds and ETFs (Chart 15). Over the same time period, the relative performance of non-U.S. stocks has been extreme, trailing the U.S. index by over 75%.
Amid the concerns over capital flight from the U.S., Lyell continues to view most of the best, innovative and leading companies to be headquartered domestically. The Artificial Intelligence era is being primarily led by U.S. companies. It seems unlikely that global capital will avoid participating in the future growth of these industries and leaders by shunning USD investments.
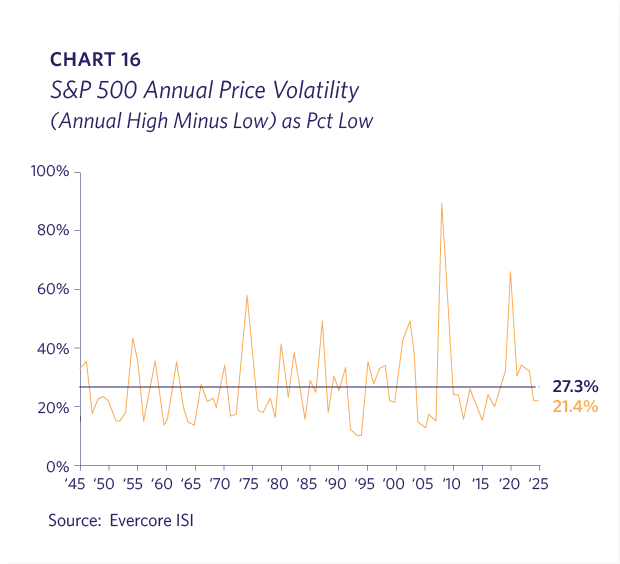
Although the volatile early months of 2025 have felt unusually treacherous, we are reminded that the average range of the S&P 500 in any given year is 27% (Chart 16).
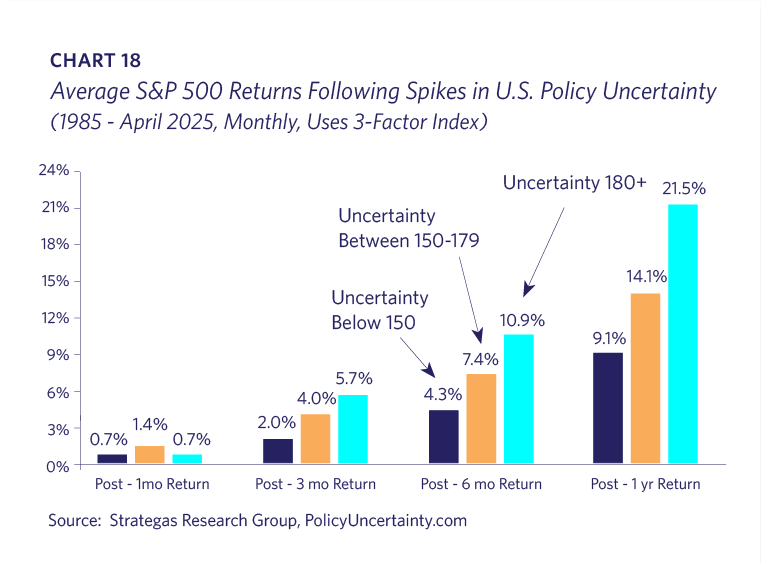
U.S. Policy uncertainty is at an all-time high based on some tracking indices (Chart 17). Historically, stock market returns outperform historical averages following these spikes in uncertainty (Chart 18).

It is inevitable that the U.S. will someday surrender its financial position as the foundation for the global economy. How the U.S. addresses its fiscal imbalances, trade relationships, and geopolitical standing will affect the timing of this transition. However, we think it is a misreading of recent events to claim that this realignment is underway.