September 12, 2019
DOWNLOAD PERSPECTIVE
The markets are contending with many significant issues that have led to increased volatility. The primary issue is the U.S.-China trade war and associated slowing of the European, Japanese and Chinese economies along with decreased U.S. manufacturing and business investment. The Trump administration is challenging the mercantilist and protectionist trade practices which have turbo-charged China’s ascension to the world’s second largest economy. China is not only the largest engine of global growth, it has also become highly intertwined within global logistics and trading networks. Irrespective of one’s view of the merits of confronting China’s trade practices or the methods used, the tension and uncertainty are depressing economic activity, especially in the more cyclical corners of the global economy.
As a result of the trade war and developments addressed below, the economic and financial risks have increased over the past year. The President is running a high-risk strategy, hoping that he can renegotiate the US – Chinese trading relationship without tilting the global economy into recession. While we believe both parties likely need to experience more economic pain before a deal can be reached, we also think it may be premature to conclude that the long economic expansion and bull market will soon end.
Concerns
Overseas Weakness
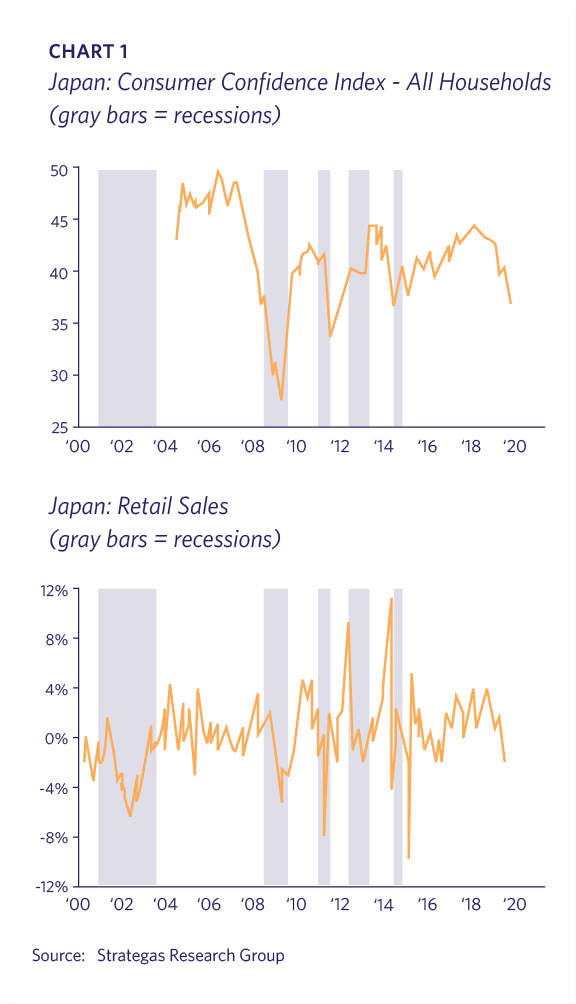
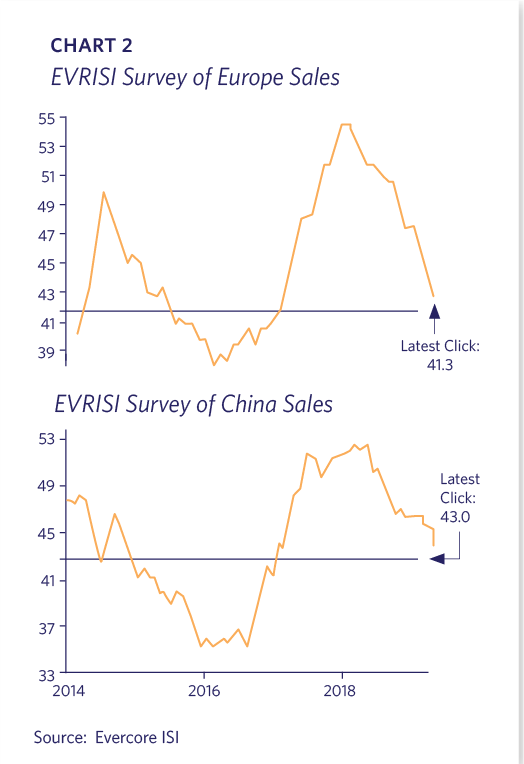
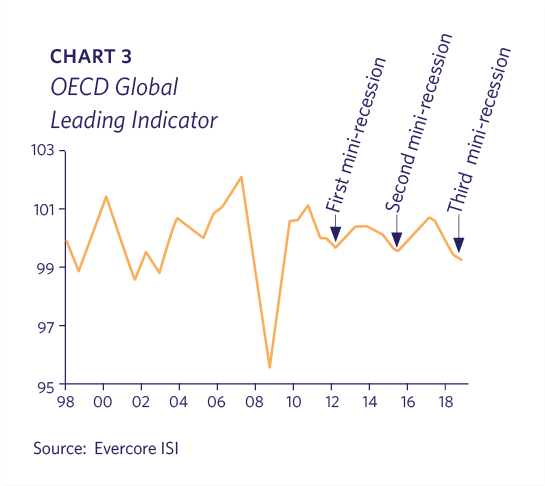
As global trade slows, manufacturing and export-led economies are the first to feel the pain. Germany, which accounts for the same share of world exports as the U.S. despite having only a quarter of the population, may have entered a recession this past quarter. Meanwhile another export economy, Japan, has been mired in a stagnant growth environment for three decades, yet its government plans to raise its value-added tax in October. Consumer confidence and spending are therefore falling (Chart 1). Lastly, China’s economy has been slowing. Although the country’s leadership is providing stimulus, it isn’t acting as aggressively in confronting deceleration as it has in the past. The Hong Kong mass protests add to China’s risks. Evercore ISI’s survey of companies’ sales to Europe and China illustrate the slowdown taking place in both markets (Chart 2). The OECD’s global Leading Economic Indicator (LEI) declined in July, and is now weaker than it has been at any time in almost 10 years (Chart 3).
Slowing U.S. Manufacturing and Business Investment
It is likely that President Trump doesn’t fully appreciate how overseas economic weakness feeds back into the U.S. economy. Trade related industries, such as manufacturing, transportation and agriculture, have shown clear deterioration in recent months as the trade war has heated up and the global economy has slowed. The 2017 Tax Reform bill provided substantial incentives for capital expenditures, but this potential stimulus is being negated by the high level of uncertainty. Lower business investment will result in reduced future productivity and economic growth.
Interest Rates Falling
The European and Japanese economies have had emergency-era monetary policies for a decade as they’ve struggled since the Global Financial Crisis (“GFC”). Specifically, the European Central Bank (“ECB”) and Bank of Japan (“BOJ”) have introduced the novel concept of negative interest rates in which the investor locks in a guaranteed loss if held to maturity! Despite no evidence that these policies are achieving a benefit, the ECB doubled down by lowering its deposit rates from (0.40%) to (0.50%) in September. The Swiss deposit rate is already at (0.75%). The growing recession fears and threat of rates plumbing even more negative levels has caused bonds to rally and yields to fall throughout the curve. The amount of global negative-yielding debt jumped from June’s $12 trillion to over $17 trillion by late August 2019. It is fair to ask why, if negative interest rates have thus far failed to stimulate these overseas markets, will more of the same medicine result in a better outcome?
Inverted Yield Curve
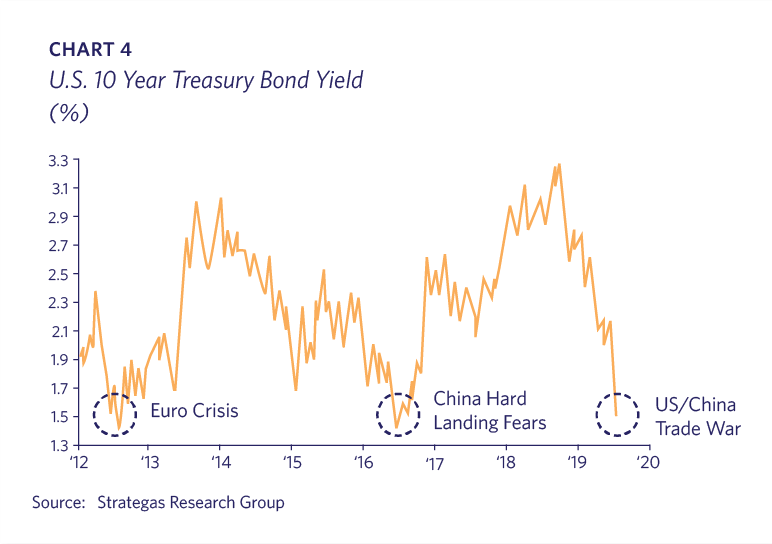
Global bond yields collapsed in early August as President Trump surprised the markets with additional tariffs on Chinese goods. This sparked a flight to safety, with investors selling risky assets and buying government debt, leading to the fourth biggest August rally in long-dated bonds in 46 years. U.S. 10 year Treasury Notes that yielded over 2.00% in early August ended the month at 1.50% (Chart 4). Given that the U.S. economy is not in a crisis, the Federal Reserve (the “Fed”) has tried for several years to normalize monetary policy by slowly raising short-term interest rates. With Fed Funds pegged over 2.00% and long-term rates collapsing, the U.S. yield curve “inverted” in August with the 3 month Treasury Bill yield exceeding that of the 10 year Note; the 2 year Note yield was also higher than the 10 year at times (Chart 5).
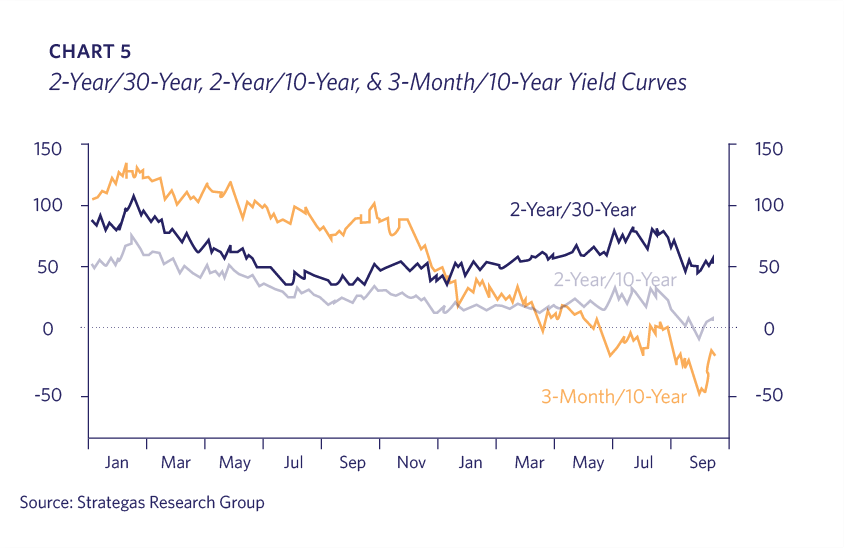
The problem for markets is that an inverted yield curve is widely considered to be one of the most reliable recession signals among all economic data points. Each recession since 1956 has been preceded by an inverted curve with a false signal occurring only once. There is some debate over how long an inversion needs to occur in order to signal a recession, and it is unclear whether an inversion is the cause of eventual recession or merely a symptom. Nevertheless, some investors, traders and algorithms took the inversion to signify that the ten year economic expansion will end within the next year, and reacted by selling stocks and buying bonds.
It appears that the shot clock is now ticking, with only the Fed able to re-set it by lowering short term rates and un-inverting the curve. While the Fed did lower rates by 0.25% at its July meeting, it has been unwilling to move more aggressively. In retrospect, it is clear that the Fed and its Chairman Jerome Powell made a mistake in hiking the Fed Funds rate last December. Investors are now unsure whether they can count on the Powell Fed to forcefully support the economy. It is a near-certainty that the Fed will lower rates again in September, and perhaps in October as well. The question is whether this will be too little, too late.
Positive Signs
Fortunately the U.S. traditionally leads the world into recessions and not the other way around. Economic slowdowns in Europe and Japan, while not ideal, are not enough in isolation to warrant fears of a U.S. recession.
If one were to ignore the fixed income markets, the U.S. economy is, at worst, muddling through. While manufacturing is undeniably slow, the consumer side of the economy is showing little signs of weakness. At roughly 70% of the economy, a strong consumer has historically been more than enough to offset weak manufacturing.
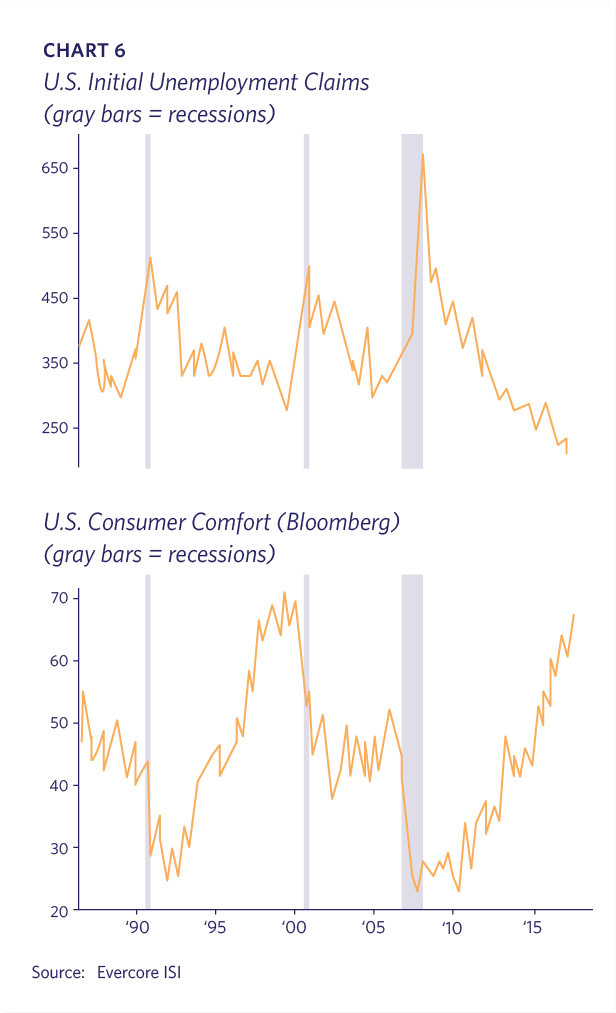
There are numerous data points that indicate a still moderately expanding economy. S&P 500 revenues increased by over 5% in 2019’s second quarter, while S&P dividends were up 7% year over year. Money supply in the U.S. continues to grow. Bank credit metrics, such as net interest margins, charge-offs, dividends and business loans, aren’t signaling a credit crunch. Initial unemployment claims remain at historically low levels, and this weekly data series has always changed trend prior to recessions occurring. Meanwhile, consumer comfort has maintained the high levels previously only achieved in the latter part of the 1990s (Chart 6).
No Credit Stress
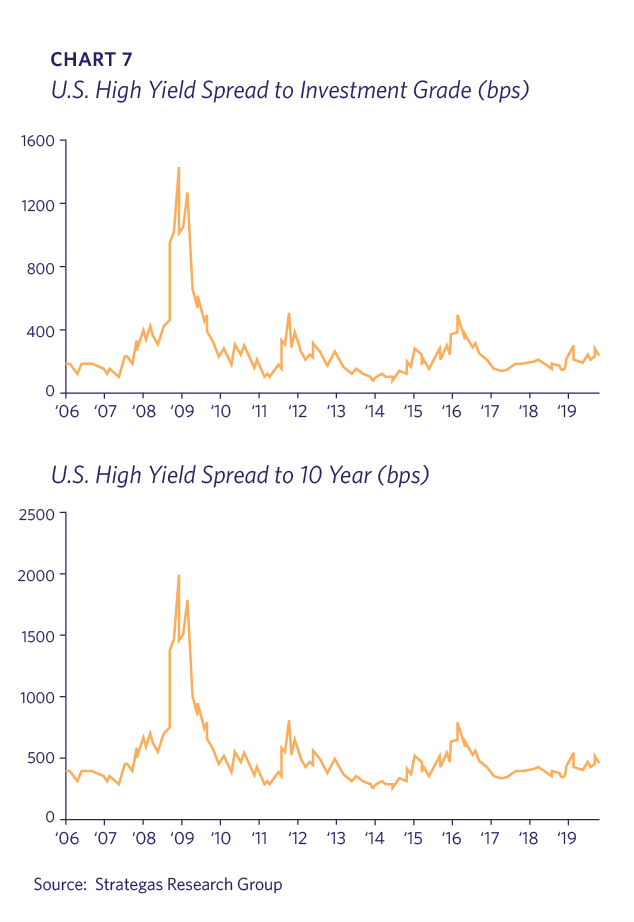
Importantly, the market turbulence has caused little stress in the credit markets. If we were heading into a recession, Lyell Wealth Management would expect to see an increase in the differentials between U.S. Treasury rates and Corporate Investment Grade rates. We would in particular expect High Yield spreads to increase significantly. Any spread widening has been modest to date and hasn’t blown out as it did in 2011 or 2015-16, and certainly not like 2008-09. Thus far at least, this is the “dog that didn’t bark” (Chart 7).
Lower Rates Good for U.S Growth
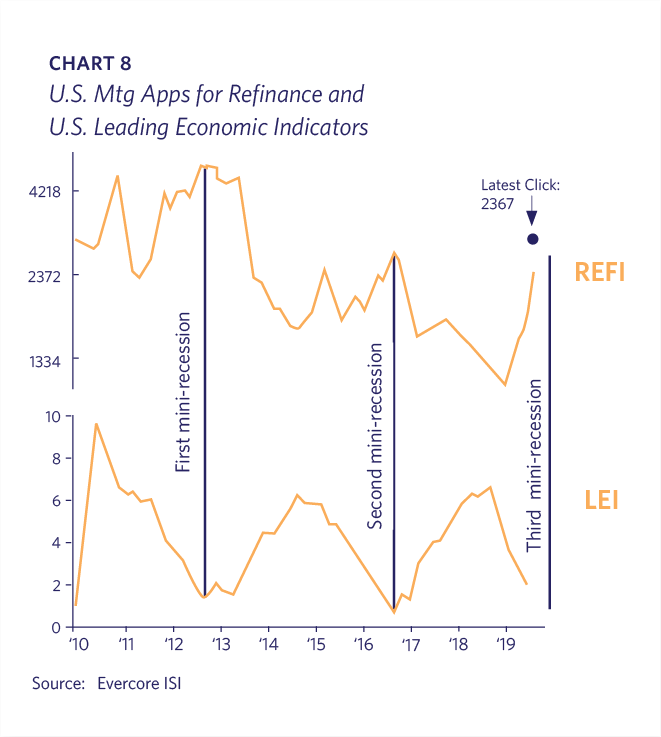
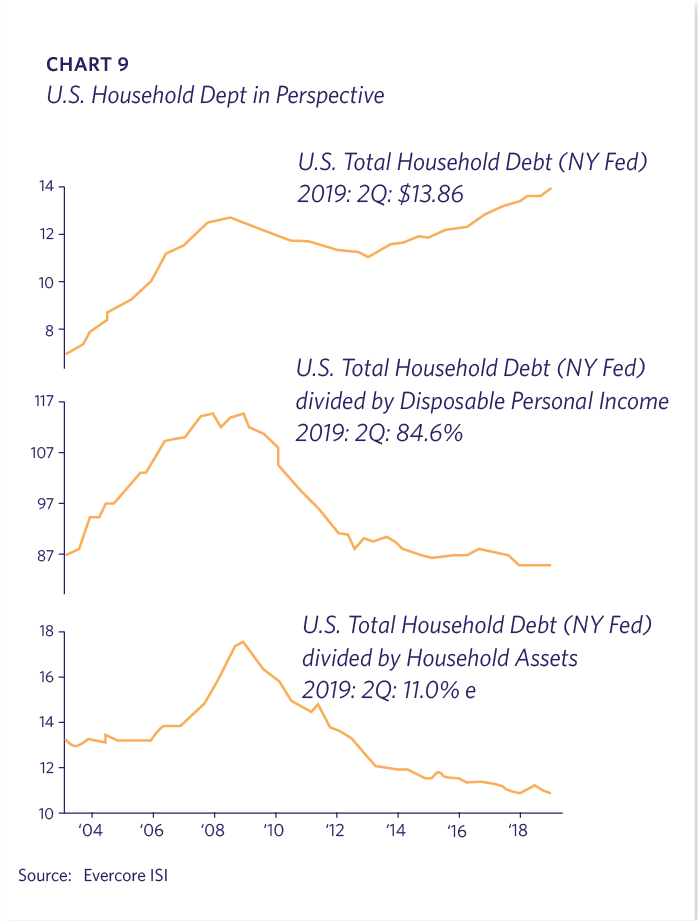
In addition, the worldwide slowdown is leading to a wave of global monetary easing. The U.S. is suddenly enjoying lower interest rates and banks are eager to lend. U.S. home re-financings have spiked, and homeowners are reducing mortgage rates on millions of homes. During this expansion a jump in mortgage re-financings has twice presaged a turn in economic leading indicators and growth (Chart 8). New and existing home sales data indicate that housing is receiving a boost as lower rates improve affordability. Although total U.S household debt is well above its 2008 highs (there are ~25 million more Americans in 2019 than a decade ago), debt as a percentage of disposable income and assets is significantly lower than prior to the GFC (Chart 9).
Low Energy Costs
Another encouraging development is that slowing economies are benefiting from low energy prices. A barrel of West Texas Intermediate oil was priced at $55 as of early September versus $75 in October 2018. For perspective, oil hit $140 a barrel in 2008 helping spark the GFC meltdown. Every U.S. recession in the past 50 years was preceded by a sharp run-up in energy prices. Although the U.S. re-emergence as a major oil producer has changed the equation somewhat, the economy still benefits more by consumers saving on energy costs than it loses by oil and gas companies struggling with lower prices.
Third “Mini-Recession”?
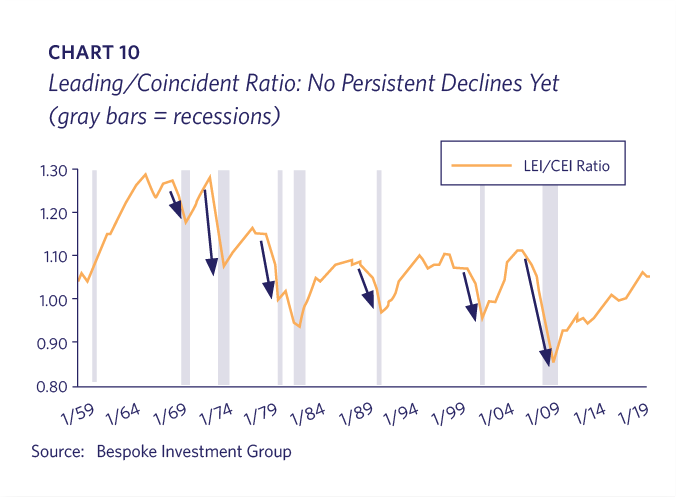
Thus far the current economic environment seems closer to 2011 and 2015-2016 than 2008-2009. Some analysts are referring to the current weakness as the third “mini-recession” of this expansion; the first two have not been actual recessions but rather notable slowdowns that caused market volatility and wrung out excesses. The Lyell Wealth Management metaphor has been that these periods have acted like moderate earthquakes relieving seismic stress and forestalling “The Big One.” The leading versus coincident ratio has not exhibited the persistent decline which has occurred in prior recessions (Chart 10).
The sum of the data suggests that the U.S. is growing at a ~2% real growth rate rather than the ~3% rate from 2018 and early 2019. These are hardly the levels that would, in isolation, warrant panic on the part of investors.
U.S. Stock Market
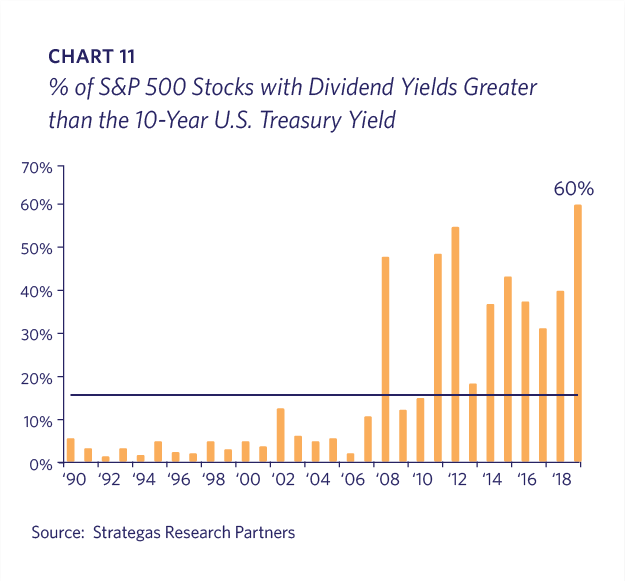
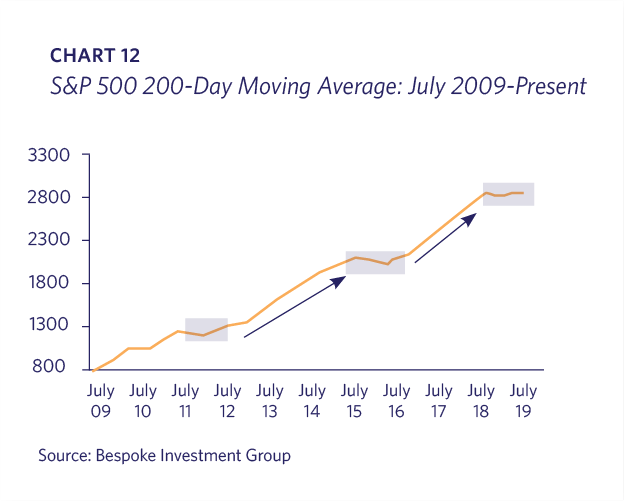
As a result of the plunge in interest rates, in early September 60% of the S&P 500 offered higher dividend yields than the U.S Treasury 10 year Note (Chart 11). The average premium is greater than 0.50% versus a deficit of 1.00% almost one year ago. The S&P 500 is essentially where it was in January of 2018; this flat-lining smooths over 2018’s fourth quarter plunge and the subsequent full recovery during this year’s first half. The S&P 500’s 200-day moving average has been trending sideways for a year, but during this decade-long bull market all the gains have come in three waves with three sideways periods interspersed (Chart 12). We are currently in the third sideways pattern.
Sentiment
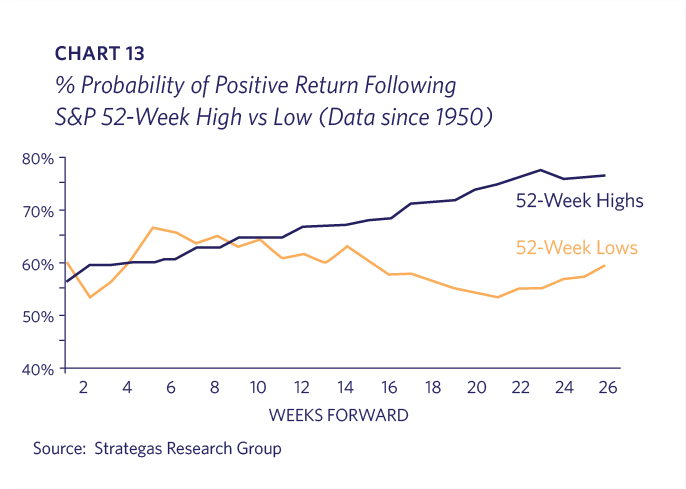
Investor sentiment is a useful contrarian indicator when it hits extremes, whether up or down. Sentiment today is undeniably favorable, in that it is severely negative. The put/call ratio spiked in late August. Similar spikes have historically been followed by above average stock market returns. An August 23rd Evercore ISI survey indicated that the lowest percentage of investors (40%) in eight years expected the market to be higher in one year. In terms of trend, since 1950 the probability of a positive return in the U.S. stock market is higher following a 52-week high than after a 52-week low (Chart 13). Note that the S&P 500 has experienced multiple new highs in 2019, most recently in late July. The bearishness extends beyond investment professionals, as today’s media is fixated on crashes and bear markets. In August there were more mentions of “recession” in news stories than at any time since 2009. If there is truth to the traditional assurance that “bull markets die in euphoria,” we can take comfort from the current widespread negativity.
Investment Strategy
Lyell Wealth Management determined in the summer of 2018 that it could not confidently predict the course of the trade tensions between the U.S. and China. This view has been confirmed as news or tweets on the subject jolt the markets in either direction. We believe the President closely monitors the stock market as well as polls in key swing states; he does not want voters heading to the polls next fall in a recession. However, his willingness to challenge established norms and relationships despite the precarious global economy is a dangerous strategy. Similarly, if the Federal Reserve were to ignore the message from the inverted yield curve it would be a perilous policy decision. If President Trump continues to escalate the trade war and/or the yield curve stays inverted, then we would increase the odds of a recession and a more prolonged market slump. The situation reminds us of the childhood warning not to run with scissors – all it takes is one small slip and an otherwise benign situation can turn into a disaster.
Lyell Wealth Management believes that portfolios should be well diversified so that clients can withstand economic or market shocks. Allocations vary for each client but liquidity and diversification are paramount based on unique circumstances. In our equity allocations, we are primarily focused on investments in U.S. companies that have strong competitive positions and secular growth opportunities. These stocks will hopefully be less impacted by specific policy enactments and political surprises. Bond portfolios remain high quality and fairly short in duration. Bonds and cash are incorporated to provide liquidity, stability and downside protection more than upside potential. Select private real estate via trusted managers is appropriate for certain clients, though at this point in the cycle it is challenging to find attractively priced assets.
Doomsday scenarios rarely come to pass. Attempting to time the market by raising a lot of cash may sound good in theory but is very difficult to execute in reality. At the same time, we remain mindful of the risks. The prudent approach at this moment is to stay diversified and avoid betting on what the next tweet may be.