September 24, 2025
DOWNLOAD PERSPECTIVE
There are concerns about the market’s rapid advance, elevated valuations, and the possibility that too much optimism around Artificial Intelligence (“AI”) has already been priced in. While we acknowledge these risks, we believe the underlying economic and market data continue to support further upside in the current bull market.
The U.S. stock market has climbed with remarkable consistency since the post-“Liberation Day” April lows. Various stock market indices have hit all-time highs despite ongoing trade and tariff uncertainty (Chart 1).

It’s no secret that the “Mag 7” (Alphabet, Amazon, Apple, Meta, Microsoft, Nvidia, and Tesla) have been major contributors to the market’s advance from the April 9 lows. However, it is encouraging that “early cyclical” sectors such as Banks, Homebuilders, and Small Cap stocks have also been providing market leadership (Chart 2). “Defensive” sectors, meanwhile, such as Consumer Staples and Health Care, have been laggards. This set-up suggests stronger economic growth ahead.

Since the current bull market began in late 2022, S&P 500 Earnings per Share (“EPS”) growth has increased by 18%, lifted by the Communication Services (i.e. Alphabet, Meta, Netflix) and Technology sectors which increased EPS by 69% and 35%, respectively. The S&P 500’s EPS has only grown by 5.8% when the contributions from those sectors are removed (Chart 3). This financial data explains why there has been such significant stock outperformance by these high secular-growth sectors. Q3 2025 EPS estimates assume continued strong growth by Technology companies, but also significant contribution from several cyclical sectors (Chart 4).


Operating margins are currently expanding, reflecting greater corporate efficiency and profits. Bear markets and recessions are almost always preceded by falling margins (Chart 5). Similarly, since the mid-1980s, all U.S. recessions and major bear markets were preceded by periods of profit contraction, with the average lead time of 10 months. There are no signs of U.S. corporate profits deteriorating (Chart 6). Corporate credit spreads in the fixed income market are compressed, which is another indicator that the market doesn’t anticipate a recession.


The current bull market has been highly unusual in that it has experienced tight monetary policy throughout (albeit following a period of exceedingly loose policy). Every bull market since 1955, until now, has coincided with the Federal Reserve (“Fed”) reducing rates. The Fed Funds rate has been considerably higher than where it started for all of the first 32 months of this bull market, as compared to the uniform decreases during the 11 preceding bull markets (Chart 7).

The restrictive Fed policy has been reflected in an anemic 0.9% annualized M2 money supply growth during this bull market (Chart 8).

When the Fed reduced the Fed Funds rate on September 17, 2025, by 0.25%, it was only the fourth time in history that the Fed cut rates with bank stocks trading at all-time highs. Typically, by the time the Fed is easing, bank stocks are already weakening in anticipation of a recession. Bank stocks trading at highs indicate the market is optimistic about the economy. The prior three periods were in the 1990s, which was a very good time to own stocks (Chart 9).

There is a good likelihood that the Fed’s easing cycle will kickstart parts of the economy that have struggled in recent years. Interest-rate sensitive industries, such as housing and automotive, should be boosted by lower rates. The Fed has limited ability to influence 30-year mortgages, but lower short-term rates will make Adjustable-Rate Mortgages (“ARMs”) and options such as 5/1 and 7/1 mortgages more attractive. Note that ARMs were 45% of the overall market in the early 2000s. Lower rates should also accelerate single-family and multi-family construction, thereby increasing future housing supply and helping to ease inflation.
The U.S. “Consumer Stress Indicator” measures food-at-home, mortgage rates and gasoline prices. Prices have come down significantly for these household necessities but remain above the post-Global Financial Crisis (“GFC”), pre-Covid era. Lyell expects the next several years to look more like the 1990s and pre-GFC period in terms of rates, economic growth and energy prices, so this may be the “new normal” (Chart 10).

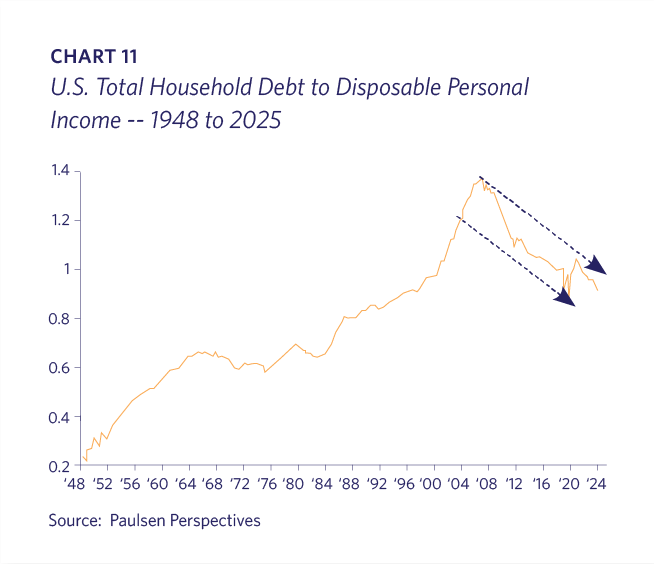
While there are signs that some lower income Americans are struggling, in aggregate the U.S. consumer has been deleveraging since the GFC, and total household debt to disposable personal income is back to late 1990s’ levels (Chart 11). Household mortgage debt as a percentage of household value is at levels last seen in the 1950s (Chart 12). There is ample home equity available, should consumers seek to access it. Financial deregulation should result in an increase in banks’ willingness to lend, which should help both consumers and small businesses. The latest U.S. Chamber of Commerce’s Small Business survey indicates confidence is at its highest level since 2017.

With the extraordinary exception of the Covid-pandemic, since WWII the U.S. has never gone into a recession when total cash and cash-equivalents exceeded 65% of GDP. The current measure is 75%, indicating substantial liquidity (Chart 13).

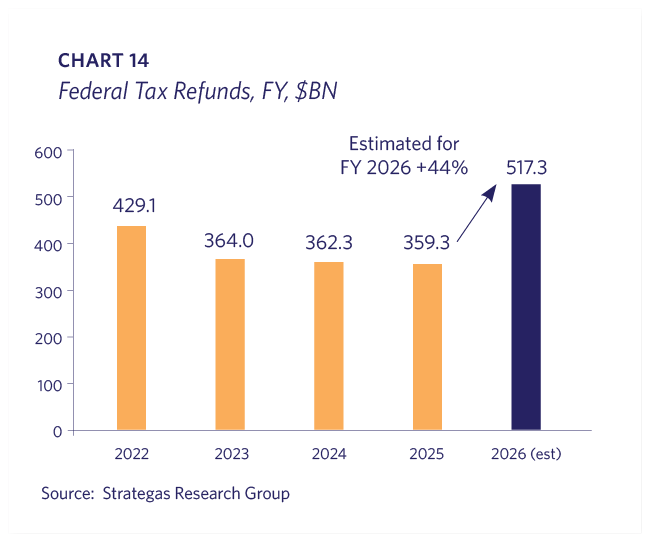
The pro-growth aspects of the “One Big Beautiful Bill,” particularly lower income tax rates and 100% capital expensing, should create an economic tailwind over the next couple of years. Consumers will get a significant boost in early 2026 with estimated federal tax refunds ~$150 billion higher than in recent years (Chart 14). Efforts to repeal non-Congressionally approved regulatory actions are likely to be upheld by the Supreme Court and are pro-growth. Tariffs are a headwind to growth as they disrupt some supply chains and increase costs for certain items. However, corporate tax savings due to the new tax rules have exceeded tariff revenue as of this date, indicating the tariff bite has been sterilized in aggregate.
In addition to these conditions, we are in a historic capital investment cycle due to the AI infrastructure buildout. ChatGPT’s adoption is unprecedented as it gained 1 million customers within five days and has obtained approximately 700 million weekly active users in less than three years. The largest Tech companies view AI as existential, in that they have the opportunity to become substantially more valuable or risk irrelevance. The common sentiment shared by these CEOs is that they’d rather risk significantly overinvesting than incur the consequences of underinvesting in this cycle. AI capital investment is accelerating at this stage, and announcements occur almost daily about a major new initiative or data-center project. Quarterly disclosures from Alphabet, Amazon, Microsoft, and Meta indicate that their capital expenditures are set to grow almost $200 billion from 2025 to 2030 (Chart 15). Based on recent comments, these capital expenditures projections appear conservative, and one wonders whether the U.S. energy infrastructure can keep up with these ever-increasing goals.

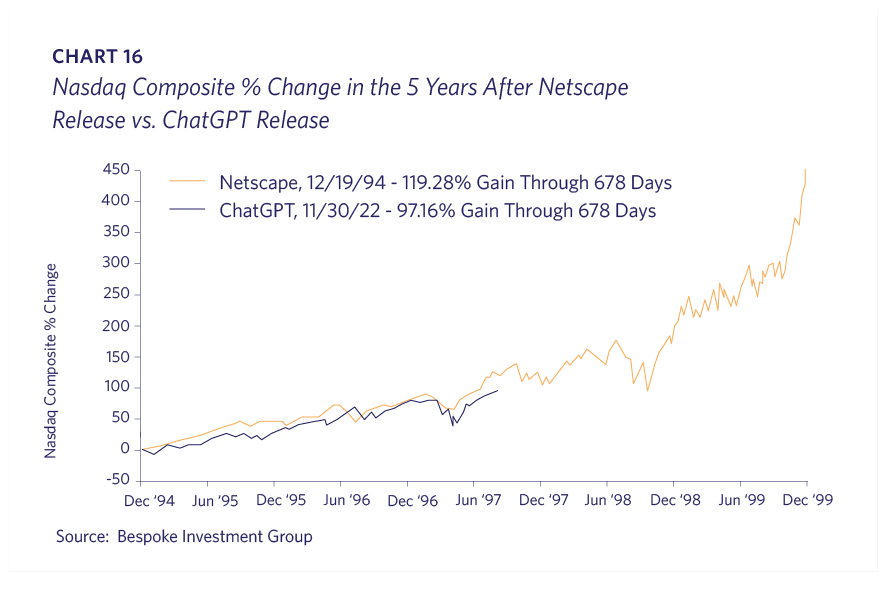
We’ve commented previously that the NASDAQ performance post-ChatGPT release looks similar to the 1990s’ post-Netscape release, and this continues to track (Chart 16).
It is likewise interesting how closely the 2025 U.S. stock market since April’s tariff turmoil has mapped to 1998’s Long Term Capital Management (“LTCM”) collapse and rescue. Note that the LTCM crisis interrupted a long-time bull market that subsequently entered a euphoric stage (Chart 17).

The technology leaders are committing record levels of investment in the race for dominance in the next economic era. This investment has both direct and indirect impacts on large swaths of the global economy, including many economically sensitive sectors. While not every current leader is likely to remain on top, the scale of the competition is without precedent. Volatility is of course unavoidable, and, given the recent strong advance perhaps a period of consolidation is needed, but we believe the intermediate-term outlook for equities remains constructive.