December 5, 2025
DOWNLOAD PERSPECTIVE
For several months now, the number one question we have received from clients is “Is the stock market in a bubble?” We understand the concern. The scars produced by the bursting of the stock market bubbles in 2000 and 2008 will forever linger with us. The good news is that, in both cases, stock markets eventually recovered what they lost. But it took several years and, at the time, it felt like it might take decades. For this reason, the financial media and many investors are hyper-sensitive to any signs of another bubble forming. While the “AI bull market” may eventually become a bubble that will burst, we do not think such an event is imminent.
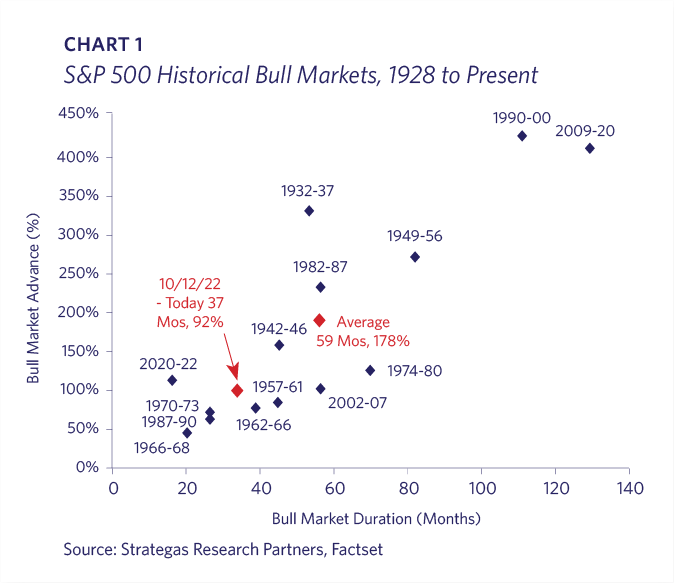
U.S. stocks have had three strong years of returns, and it is reasonable to wonder if they can go much higher after such a run. Although the circumstances are always unique, the past century provides context that the “average” bull market lasts 59 months with 178% appreciation versus the current 37 months and 92% increase. Modern bull markets have typically lasted longer, with the exception of the Federal Reserve shock-induced bear market in 2022 that preceded this rally (Chart 1).
It is easy to forget how severe the 2022 bear market was. It erased an enormous amount of wealth across stocks, bonds and real estate. This period was ultimately a valuable “reset” after the post-Covid froth seen in 2021. As a result, the five-year rolling returns for various U.S. stock market indices (S&P, S&P Equal-Weighted, and NASDAQ 100) indicate that there is nothing extreme about recent years’ performance (Chart 2).

Just as bear markets seldom occur when there is substantial negative sentiment, every U.S. major market top and crash has been preceded by the Fed tightening monetary policy. Rising rates have always been a key precondition for a market collapse, and the Fed is presently in an easing cycle (Chart 3).

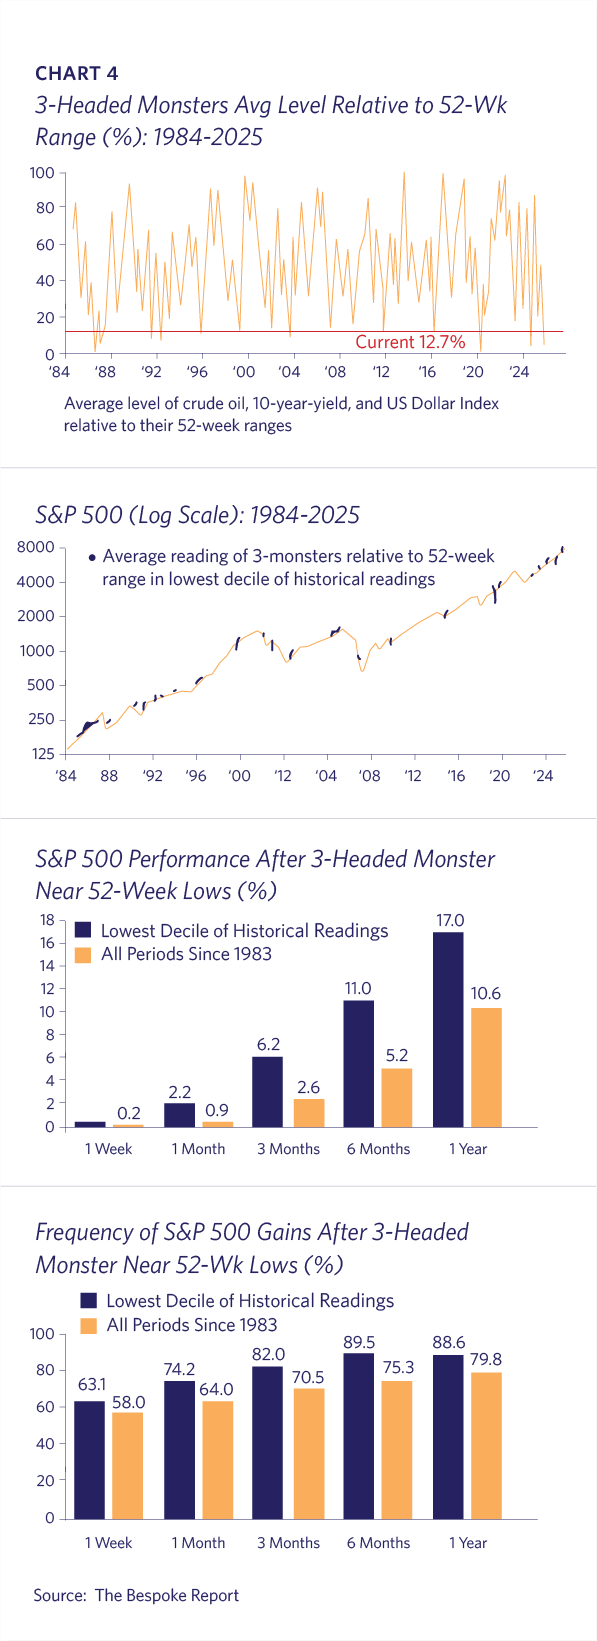
U.S. interest rates, oil prices, and the U.S. dollar index levels relative to their respective 52-week high-low ranges are in the lowest decile of all historical readings. When this “Three Headed Monster” hits these levels, forward returns are typically substantially above historical averages, and more frequently positive (Chart 4).
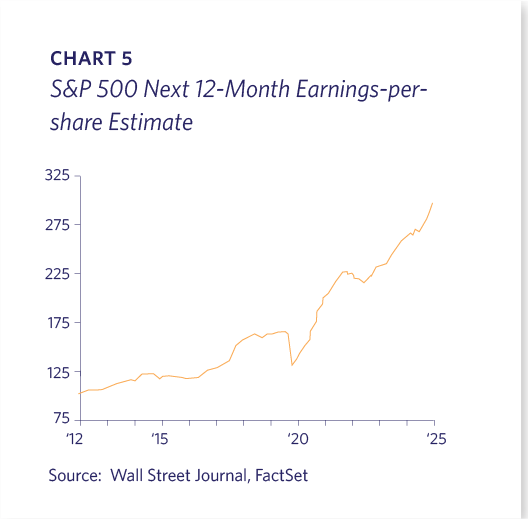
Although investors are aware that U.S. stock indices are hitting all-time highs, it is easy to miss how much Earnings Per Share (“EPS”) have increased over time. The S&P 500’s next 12 months EPS is forecast to be over $300, versus slightly over $100 in 2012 (Chart 5). The market has been strong, but so have profits.
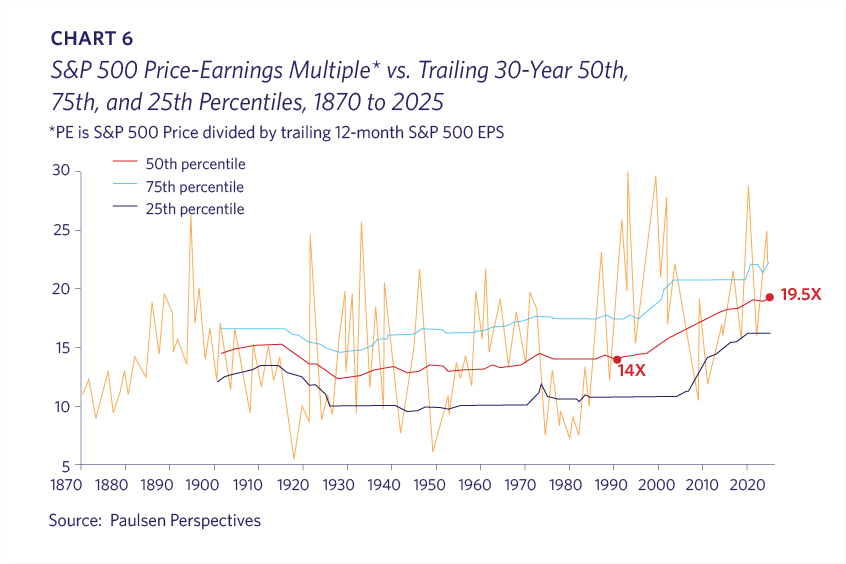
Still, it is true that U.S. stock valuations have increased noticeably over time, particularly since 1990. Price/Earnings’ multiple expansion for the S&P 500 has occurred across the entire market and has not just been pulled up by the top performers in the index (Chart 6).
Lyell Wealth Management sees several reasons for the upward valuation drift. These include:
- Globalization, which provided public companies with more customers, scale, and access to less expensive production;
- Technology, which enabled better supply-chain management and more asset-light operations, helping avoid the excess inventory build-ups which historically led to recessions;
- Digital companies that have better revenue visibility, less cyclicality, fewer assets and employees, and better margins. Consumer-facing online companies may have several billion potential customers at launch;
- A Federal Reserve that has become more proactive and quicker to address significant market weakness, providing perceived insurance against prolonged declines.
Although the Artificial Intelligence (“AI”) investment theme shares some similarities to the 1990s Internet/Telecom cycle, there are significant differences. Despite the S&P Technology sector delivering strong earnings growth in 2025, the sector’s forward Price/Earnings (“P/E”) multiple has actually declined slightly this year (Chart 7).

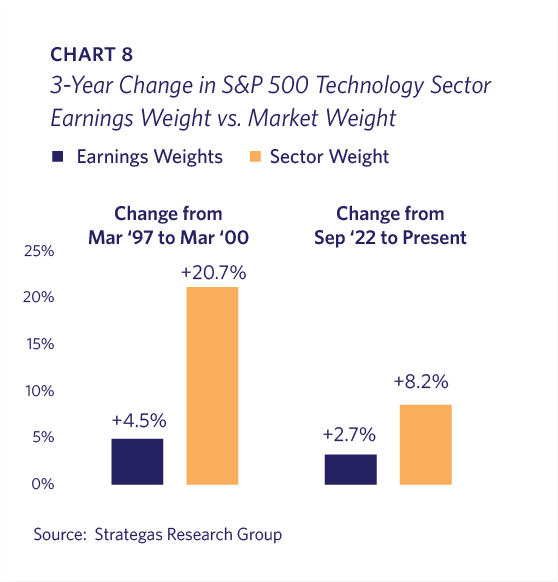
In the last three years of the dot-com era, the S&P Technology sector’s market weight increased over 20%, while its earnings contribution expanded 4.5%, signifying substantial valuation expansion. The gap is less extreme today as the Tech sector’s market-weight has only expanded by 8.2% while its earnings-weight has increased 2.7% (Chart 8).
Growth stocks’ EPS have been expanding at approximately 20% annually, which can help justify multiple expansion. This is noticeably different than the EPS slide during the late 1990s while valuations simultaneously spiked (Chart 9).

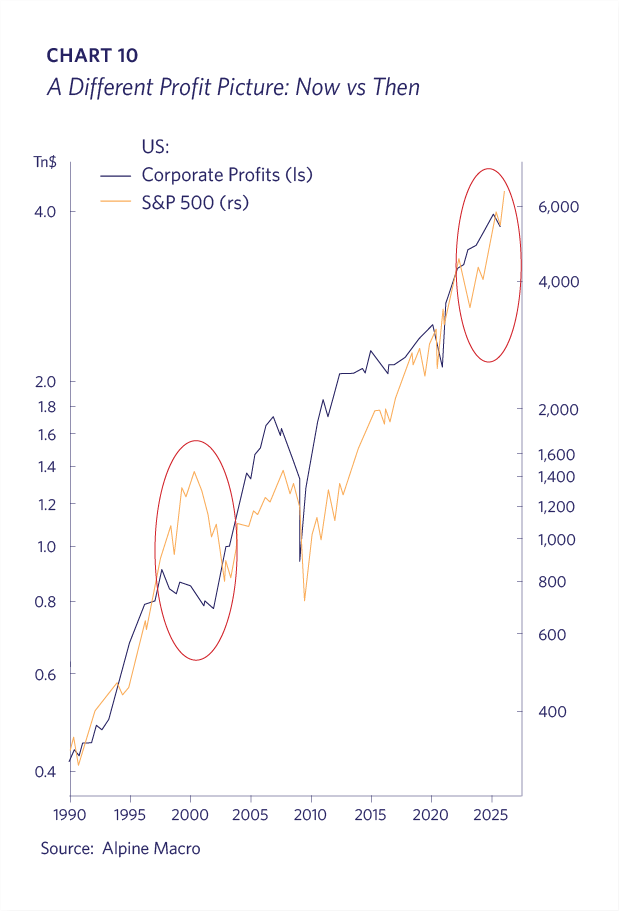
Not only did EPS drop in the late 1990s, corporate profits did likewise even as the stock market had a major advance. Conversely, corporate profits today are at all-time highs along with the stock market (Chart 10).
The P/Es for the 50 largest companies in the S&P 500 are modest when compared to those of March 2000 right before the dot-com bust occurred. Today’s market leaders are substantially more mature, profitable, and less highly valued than the 2000 cohort (Chart 11).

Investor sentiment today contrasts strongly with the 1990’s experience. Meta shares recently sold off due to an increase in its capital expenditure guidance. Oracle’s shares have similarly retrenched due to concerns about its ability to fund its large AI ambitions. This contrasts starkly to the late 90’s, when adding “dot-com” to a company’s name led to massive stock gains.
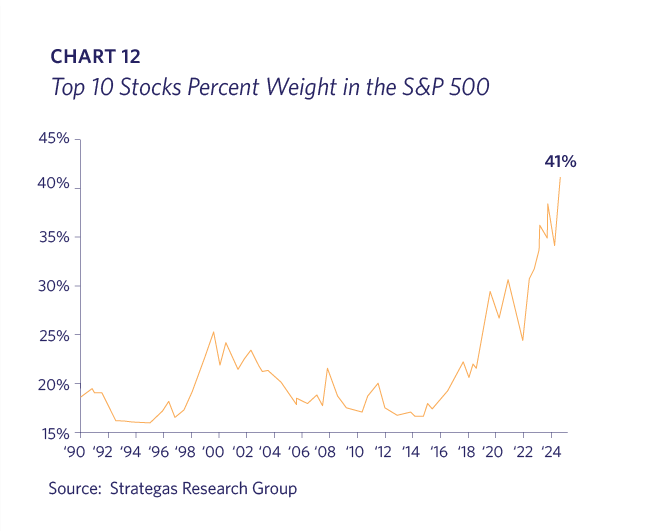
There is concern that the largest stocks are increasingly comprising more of the S&P 500 index. This is a continuation of a decade-long trend in which the “Big Tech” stocks have become increasingly valuable, as Berkshire Hathaway is the only non-Tech company in the Top 10 (Chart 12).
As Lyell Wealth Management has noted previously, the world has never seen platform companies like today’s Tech giants. An increasingly large amount of global commercial activity runs on or through these companies. Table 1 provides some perspective on the profitable growth of these companies by comparing Big Tech EPS from 2019 to 2025.

AI presents a tremendous opportunity as well as potentially existential risks to these companies. There is a race underway to build and protect competitive advantage in this new paradigm. They not only need to be concerned with each other, but also with new entrants, such as OpenAI and Anthropic. With the exception of Apple, executives at these companies have made it clear that they would rather risk over-investing in this AI cycle than face an inevitable slide into irrelevance if they do not.
The U.S. economy has experienced long cycles of productivity in its history. The last productivity surge occurred following the widespread adoption of PCs and the Internet build-out and its aftermath, as efficiencies rippled throughout the economy. It is very possible that we are at the beginning of a major productivity acceleration with profound impacts on economic growth, corporate profits, and employment (Chart 13).

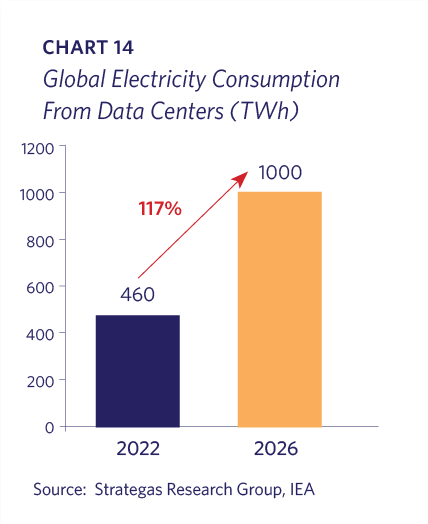
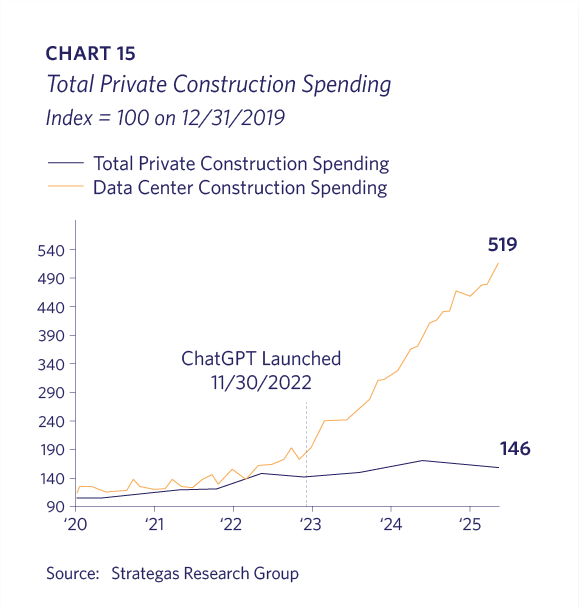
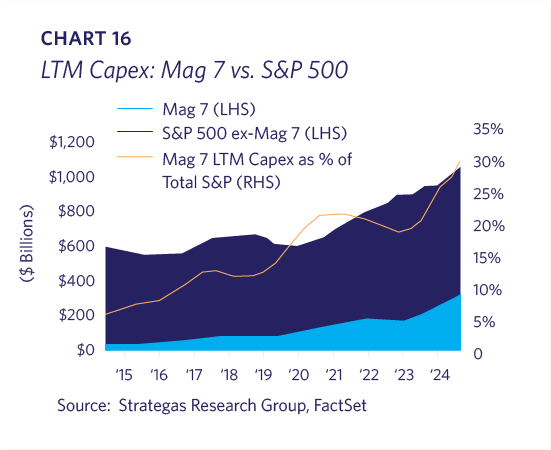
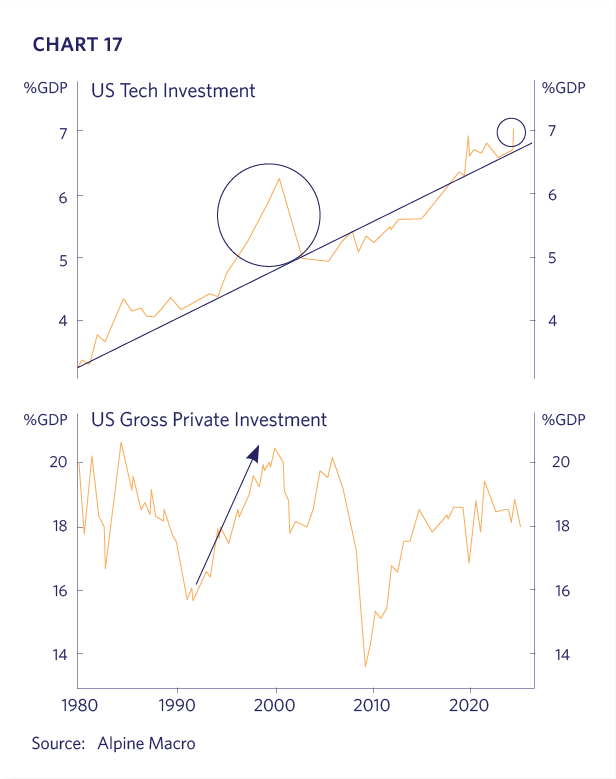
Due to the AI build-out, electricity consumption by data centers is projected to more than double from 2022 to 2026 (Chart 14). Data center construction spending has skyrocketed since the public launch of OpenAI’s ChatGPT (Chart 15). The Mag 7 (i.e. Table 1 less Broadcom) are expected to plow over $400 billion this year into AI infrastructure, and their spending now represents over 30% of the S&P 500’s capital investment (Chart 16). These record-breaking capital expenditures (“capex”) should be viewed in the context of a structural rise in Technology’s share of total investment, which has been underway for decades. Thus far, the increase above trend is moderate, particularly relative to the 1990s (Chart 17).
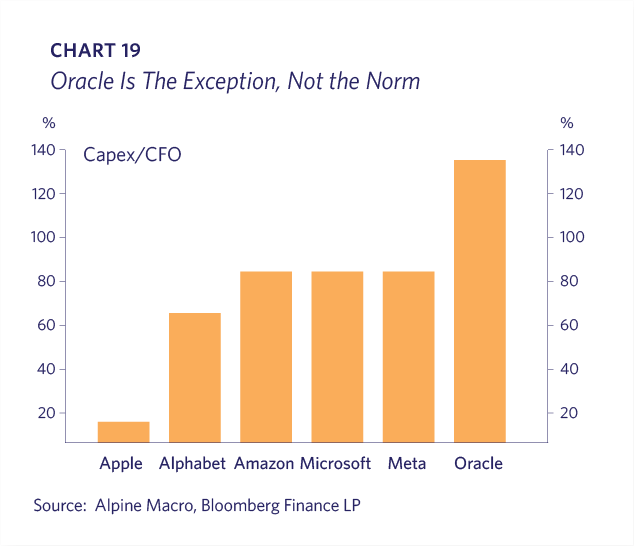
Meanwhile, most AI capex is being funded out of corporate cash flows by the Big Tech leaders with Oracle and its more debt-fueled ambitions as the exception (Charts 18 and 19).

It seems inevitable that the AI build-out will overshoot at some point when there is excess capacity to address feasible use cases. Too many companies are raising venture capital, often at nosebleed valuations. There are certainly frothy aspects that aren’t difficult to observe. Quantum computing, nuclear and crypto stocks are examples of sectors that have seen rampant speculation over the last year or two, with their prices often tripling or more despite little in the way of fundamental results. Public investors are jittery at times, wondering if we’ve reached a point where the over-build is visible, which will require fewer Nvidia semiconductors, or whether a new competitor has emerged to encroach on an incumbent.
It is Lyell Wealth Management’s view that calls for the demise of the AI super-cycle are premature. This is a global phenomenon backed by the most profitable companies and sovereigns in the world. However, we are destined for periodic bouts of doubt as long as the AI cycle lasts. As recently as late November, an investor sentiment gauge registered “Extreme Fear,” which is good news in that sentiment is typically an inverse market indicator (Chart 20).

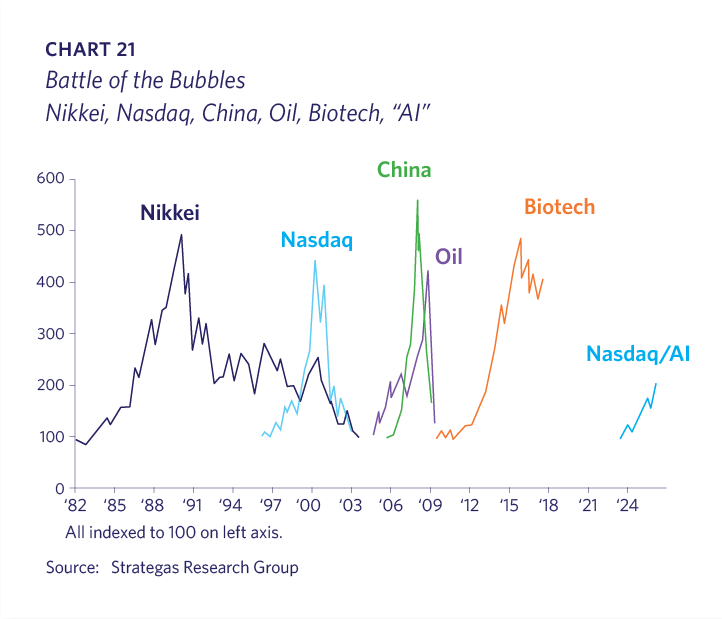
The severity of any eventual downdraft will be proportional to the degree of excess on the way up. While it may feel like the AI bull market has already been extreme, it is actually fairly tame compared to previous market bubbles (Chart 21).
Although we don’t appear to be at a market top, it is a good reminder that even the best performing stocks have periodic large drawdowns. The 20 best performing U.S. stocks over the last 25 years have traded in bear market territory (down 20% from a high) over 30% of the time. Nvidia and Amazon are illustrative of this reality (Chart 22).

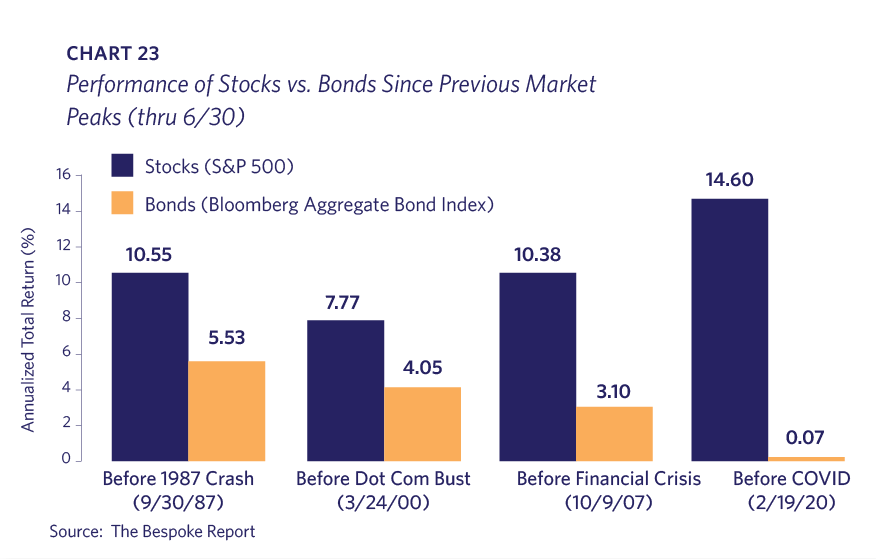
There should be solace in that time has historically resolved favorably for the stock investor who perseveres. Even for investors who entered the market right before the four largest market crashes over the past 40 years, U.S. stocks have subsequently returned a minimum annualized return of 7.77%. In each scenario, stocks outperformed bonds (Chart 23).
The upcoming year might see stronger stock market performance from companies that have struggled under the Federal Reserve’s restrictive interest rate policy. A combination of lower interest rates, lighter regulation, and resolved tariff and tax policies may help these sectors. Tech leadership in the market-cap weighted indices has masked mediocre performance from many other public company stocks. If this occurs, it wouldn’t portend a shift away from the “AI trade,” but rather a healthy market broadening.
Mid-term election years are historically the worst performing of the four-year election constellation. The typical mid-term election year also has an average 19% downturn at some point. Although historical averages are no predictor of the future, we, as always, are diligent to maintain sufficient liquidity available for clients, so they can manage both financially and emotionally through the rough times.