To many observers the global economy seems stuck on pause as Covid-19 rolls its way through different geographies. Workers able to work remotely are doing so, while millions of “non-essential workers” have been laid off or furloughed. Layoff announcements peaked recently at levels slightly above those reached at the worst points of the last two recessions (Chart 1). The U.S. has a huge hole to climb out of, as fewer than half of the jobs lost during the crisis have been recovered (Chart 2).


Washington politicians moved unusually quickly post-shutdown to provide massive funding in an attempt to backstop unemployed workers and devastated companies. This solution was highly imprecise, but in a way that was the point, as the downside risk of too little economic support was enormous. Although the latest negotiations for another round of fiscal stimulus have stalled, the consensus is that an agreement will be made in September. Not surprisingly, overall consumer confidence is still markedly lower versus where it was prior to Covid (Chart 3).
Meanwhile the U.S. stock indices are back near all-time highs. This disconnect is naturally confusing. A partial explanation Lyell Wealth Management discussed in our May 2020 Divergence Perspective is that the stock market poorly represents the entire U.S. economy. Publicly traded companies are larger, more global and have better access to capital. They are also increasingly dominated by technology and digital companies that are not only surviving, but thriving, in the current environment. Failing small businesses, local governments and non-profits aren’t traded in the public markets.
It is worth remembering that stock investors are forward-looking. Many are betting that the worst of Covid is behind us and that behavior changes, vaccines and therapies will enable us to return to normal sooner than originally anticipated. Along those lines, S&P 500 companies fared better than feared during the second quarter, with 76% beating analyst estimates for revenues and 66% for earnings. These upside surprises have been yet another factor contributing to the strong stock market.
However, there is another powerful driver of the stock market’s unprecedented recovery – liquidity. Many investors greatly underestimate the impact that liquidity has on the direction of the market. Once Covid hit, the Federal Reserve and other global central banks immediately utilized all of their tools from the Global Financial Crisis (“GFC”). They also introduced several new mechanisms that promote market stability and liquidity. One of the most unconventional, but necessary, steps was to lower overnight rates back to essentially 0% where they had spent many years post-GFC (Chart 4).
This means that “real” (i.e. “inflation-adjusted”) interest rates are now negative, in that the Fed Funds target rate is now well below inflation expectations. Savers will now see their purchasing power decline over time as inflation eats away at cash’s value. This environment provides a powerful incentive to invest or spend rather than save (Chart 5).
Furthermore, this is a global phenomenon, as short term interest rates around the world are at new all-time lows (Chart 6).
The combination of politicians distributing trillions of dollars and the Federal Reserve increasing its balance sheet by 80% year-over-year to $7 trillion has caused an explosion in the money supply. The most representative U.S. money supply figure is “M2”, which is increasing at an unprecedented 23% annual clip. China’s M2 is up almost 11% and the European’s comparable M3 is growing over 9%. The massive monetary stimulus is global (Chart 7).
The Marshallian K ratio is an economic term which is calculated by dividing M2 by Gross Domestic Product (“GDP”). When M2 is growing faster than GDP, it means there is more money entering the system than can be absorbed by the real economy. The expectation is that this “excess” money supply will then find its way into financial assets. Since the Covid crisis hit, the Marshallian K ratio in the U.S. has gone parabolic (Chart 8).
Of utmost market importance, the Federal Reserve unveiled in late August a new monetary approach of “inflation symmetry.” For many years the Fed and other central banks have targeted a 2% inflation rate of which they have consistently fallen short (Chart 9). It was universally understood that 2% was in reality a cap and that subsequent tightening would ensure it didn’t go higher. Chairman Powell is pioneering a plan to allow inflation to run above 2% in order to make up for the time it has been below that level. The goal is to allow unemployment to decline to a lower level, and the economy to strengthen more, before embarking on a new tightening cycle.
While one might minimize this seemingly incremental difference, it has tremendous implications for investment markets. Interest rates were already expected to stay low for a substantial period of time in the wake of the Covid crisis, but this pivot to even easier monetary conditions suggests that interest rates will remain low for longer than previously imagined.
Interest rates are direct inputs into every investor’s assessment of how much they are willing to pay for an asset. Lower rates mean higher valuations, all else being equal. Furthermore, imagine the challenge faced by pension fund managers tasked with earning 7% per year. Paltry bond yields should force such investors from fixed income to the stock market. After the GFC, Jason Trennert of Strategas Research Partners coined the phrase “TINA” for “There Is No Alternative” to stocks in a zero interest rate world. Recently another market economist, Krishna Guha from Evercore ISI, borrowed it to add that, with the Fed’s new policy, it is now “TINA on Steroids.”
A weaker U.S. dollar translates into greater liquidity. In addition to Congress’ fiscal largess and the Fed’s historic dovishness, the U.S. dollar is trading at multi-year lows and appears to be weakening. Currencies are impacted by many factors, however large fiscal and trade deficits are typically associated with weaker currencies. Although scary headlines may suggest that the dollar is crashing, that is not the case. It is “risk on” and positive for markets (Chart 10).
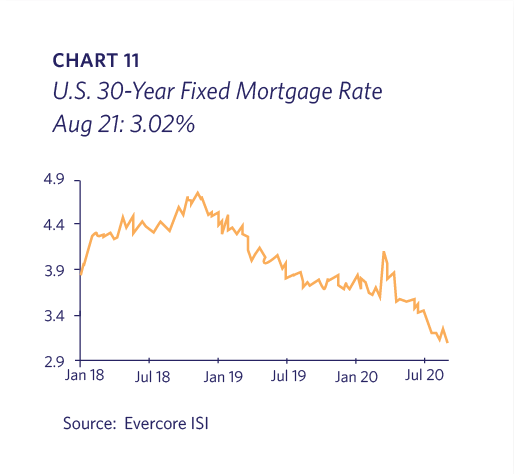
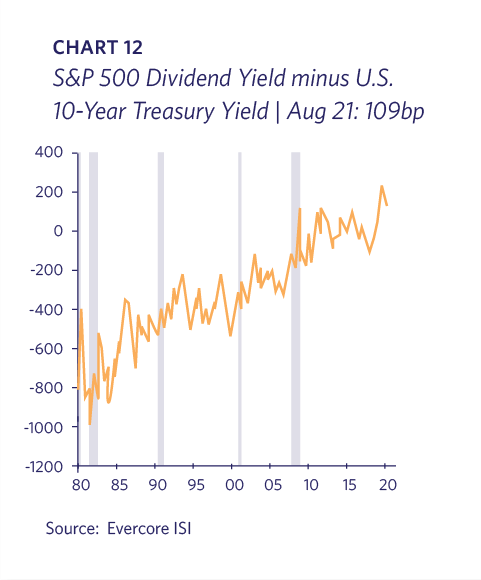
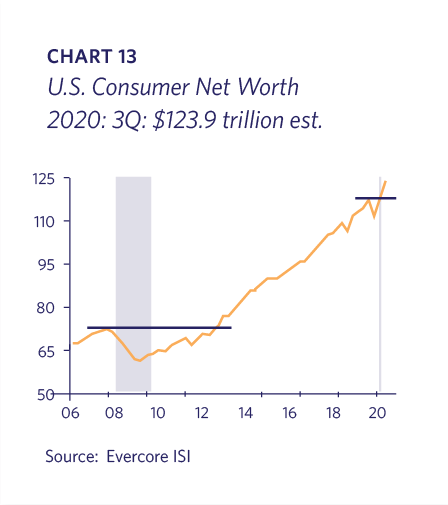
We are seeing this easy money phenomenon play out in both the stock and housing markets. Mortgage rates are at all-time lows (Chart 11), while the S&P 500 dividend yield is near a 40 year high relative to the 10 year treasury yield (Chart 12). This has contributed to a feeding frenzy in many housing markets and all-time highs in the stock market. Some may be surprised to learn that U.S. consumer net worth has hit an all-time high (Chart 13). Per Evercore ISI, consumer net worth tends to lead GDP growth by half a year, suggesting that 2021 could be a strong year for the economy.
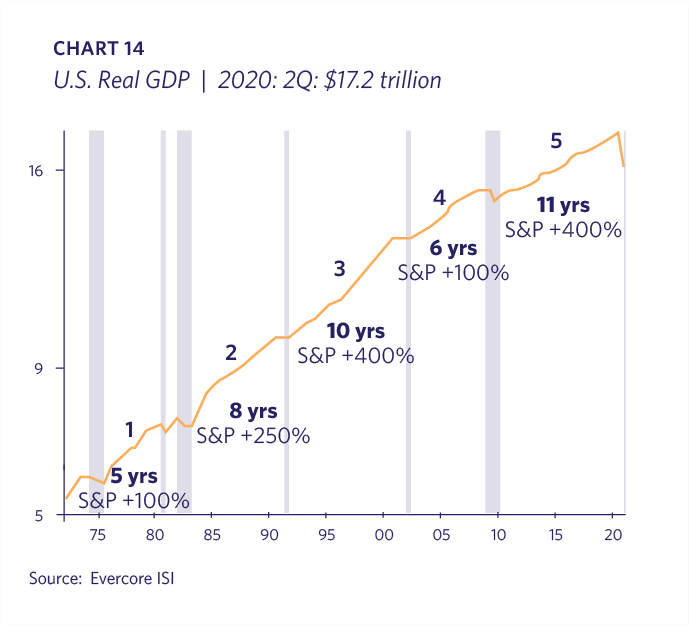
The Covid plunge and subsequent improvement means that the U.S. has started a new economic expansion. Interestingly, the last five expansions have lasted eight years on average (Chart 14). Although we are certainly not out of the woods in terms of near-term challenges, it is unlikely that another recession is imminent.
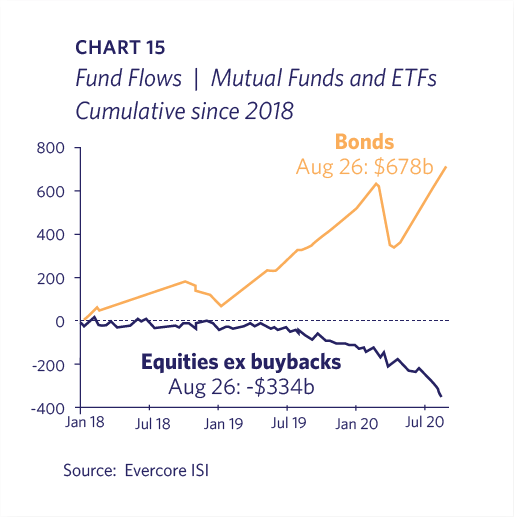
Since January 2018 investors have pulled $334 billion out of stocks and put $678 billion into bonds (Chart 15). It certainly appears that many professional investors are underweight equities, meaning that the “pain trade” is to the upside as their relative underperformance becomes more pronounced with each leg higher. The S&P 500 increased on ~81% of trading days in August, the most for any month going back to 1993. The Fed’s new policy will likely create more urgency for these investors to catch up.
Lastly, we are receiving many questions about the elections and their potential impact on portfolios. No doubt monetary policy will be very favorable with easy money regardless of the winners. Neither party is running as deficit hawks nor financial stewards, so deficits will stay high and stimulative. Taxes and regulations will likely be higher with a Democratic sweep, but Lyell Wealth Management’s view is that this will affect specific industries, such as energy, banking and health-care, more than the overall economy. We are incorporating these different scenarios into our investment process. As always, we are double checking that client portfolios are appropriately allocated to withstand the periodic volatility that inevitably occurs.


