July 27, 2016
DOWNLOAD PERSPECTIVE
There is a tendency to overstate present challenges, feeling that things have never been more uncertain. We romanticize the past, believing that prior eras were easier. With the benefit of hindsight, we downplay the severity of the threats from those times. The future, in which survival or success are uncertain, feels riskier and scarier. So to the question “why would you start a new investment firm now,” our response is “since when was investing easy?” The challenges of our profession are ever present.
There is no denying that the level of angst is at an elevated level, and the resolution of many unsettling trends is unclear. Investors are facing unprecedented opportunities, risks and challenges. As a result, the need for trusted financial counsel is as high as ever.
It is Lyell’s investment thesis that the U.S. economy is mid-cycle with more time remaining in this elongated expansion. However, the global backdrop in an increasingly interconnected world presents a less positive outlook. Europe and Japan are struggling for growth. China’s economy is slowing amid a transition from one fueled by exports and over-investment to one driven by consumer- led services. Commodity exporters which benefitted from China’s boom are retrenching as prices have plummeted. There is widespread political turmoil as electorates demand better outcomes from their leaders. Finally, the Central Banks’ monetary experiments present potential unintended consequences worthy of attention.
The U.S. Economy
The U.S. economy is in its seventh year of economic expansion which makes it one of the longest on record. However, the pace has been modest at best. Recessions are usually caused by accumulated excesses, tightening credit conditions, or economic shocks. Excesses in this cycle beyond those in the energy industry and the valuations of VC-funded companies are difficult to identify, unless one views low bond yields as a bubble.
Most of the pain from the oil collapse is already past. A rationalization in over-valued, privately funded companies, including some previously valued at over $1 billion (the “unicorns”), is underway but will largely be felt by paper gains turning to lesser gains or paper losses. Silicon Valley will be able to weather the bubble leak as it has become the nexus of the global economy. This will not be a repeat of the dot-com bust.
Employment and the Consumer
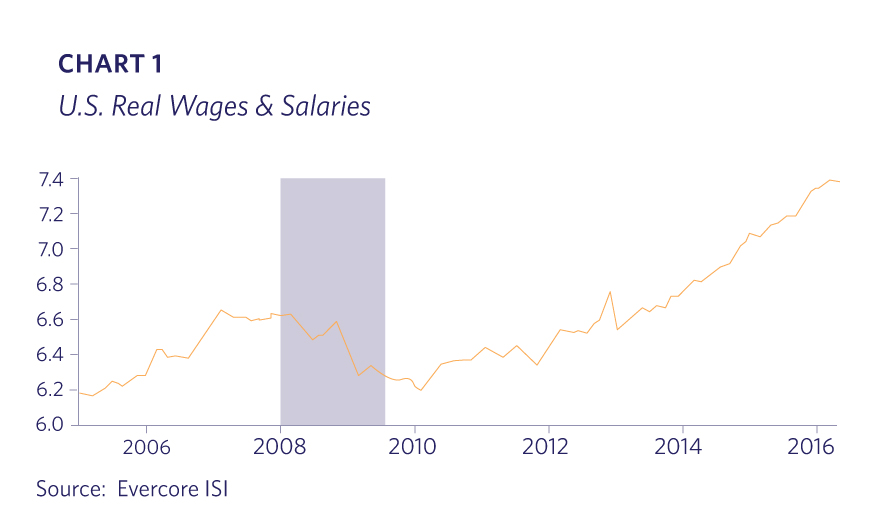
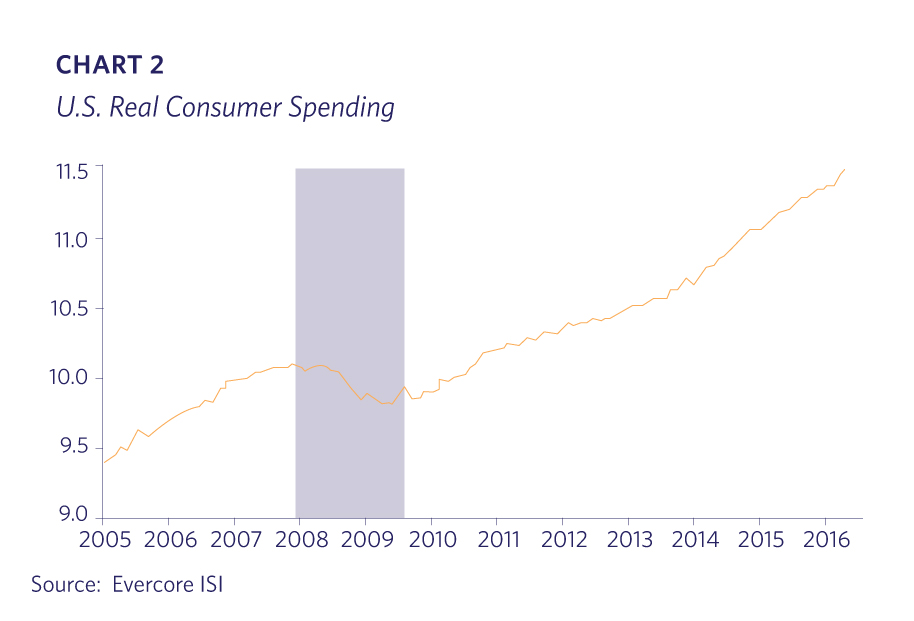
U.S. wages and salaries, as well as consumer spending, show a more positive picture than one might pick up from the media as shown in the following charts (Charts 1, 2).
Amazingly, the current streak of 72 consecutive weeks of Unemployment Claims under 300,000 is the longest since 1973. The U.S. population was 211 million in 1973 versus 322 million legal residents today. The 50% larger population makes this statistic even more impressive. Weekly U.S. Initial Claims for Unemployment shows a historically tight employment market (Chart 3).

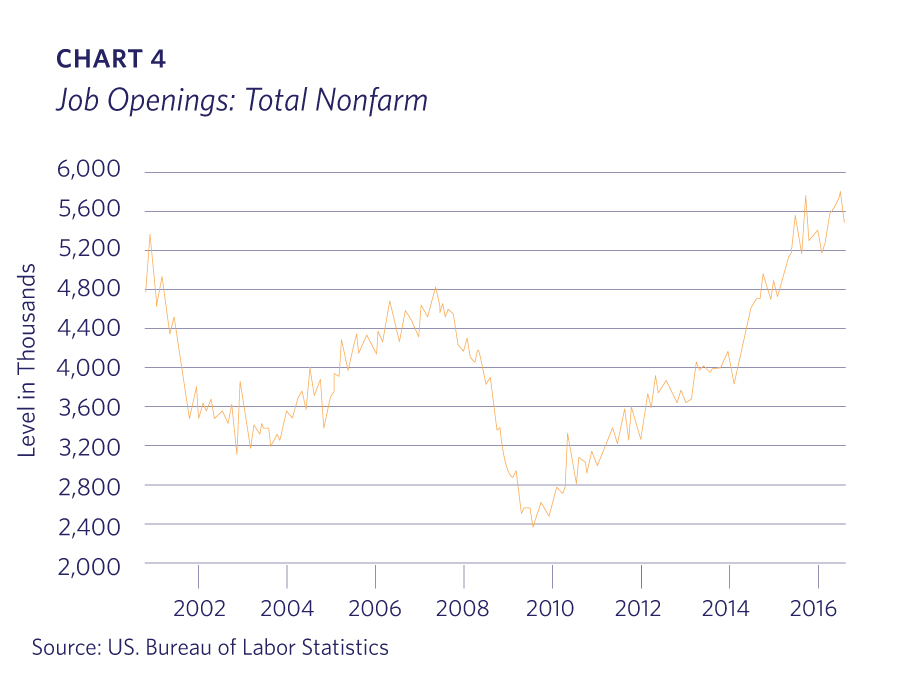
The Job Openings and Labor Turnover Survey (JOLTS) remains near its highest level ever at 5.6 million per the Bureau of Labor Statistics (Chart 4).
Numerous data points indicate rising wages and earnings for the American worker. Labor market tightness plus increased minimum wage laws are obvious contributors. There are also signs of an increase in job-hopping which can imply better fits for worker skills, thereby increasing employee productivity. If productivity improves, then higher wages don’t need to eat into corporate profits.
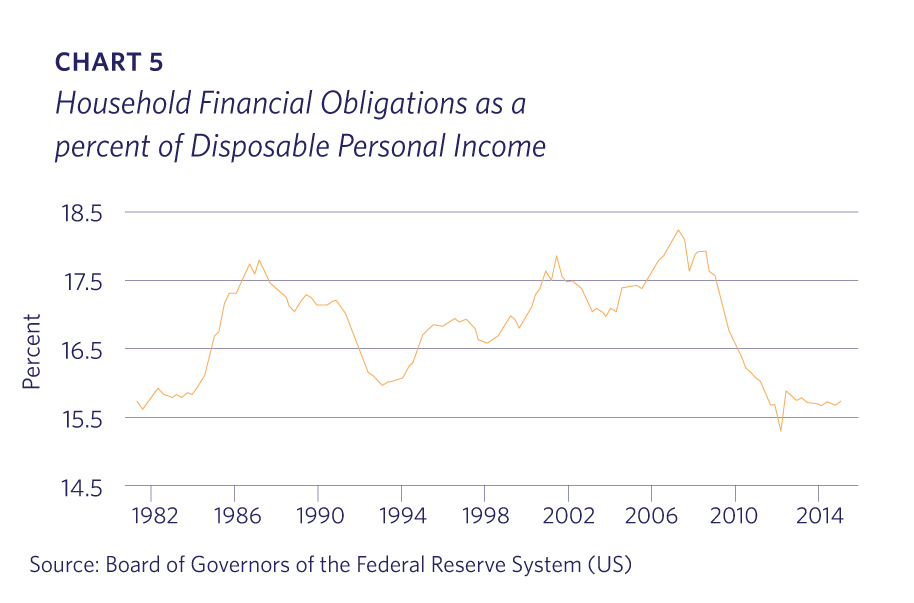
U.S. households are in the best financial condition in decades in terms of debt payments as a percentage of personal income. This financial health is due to low interest rates, restrained spending and the fact that substantial debt was cleared by default after the financial crisis (Chart 5).
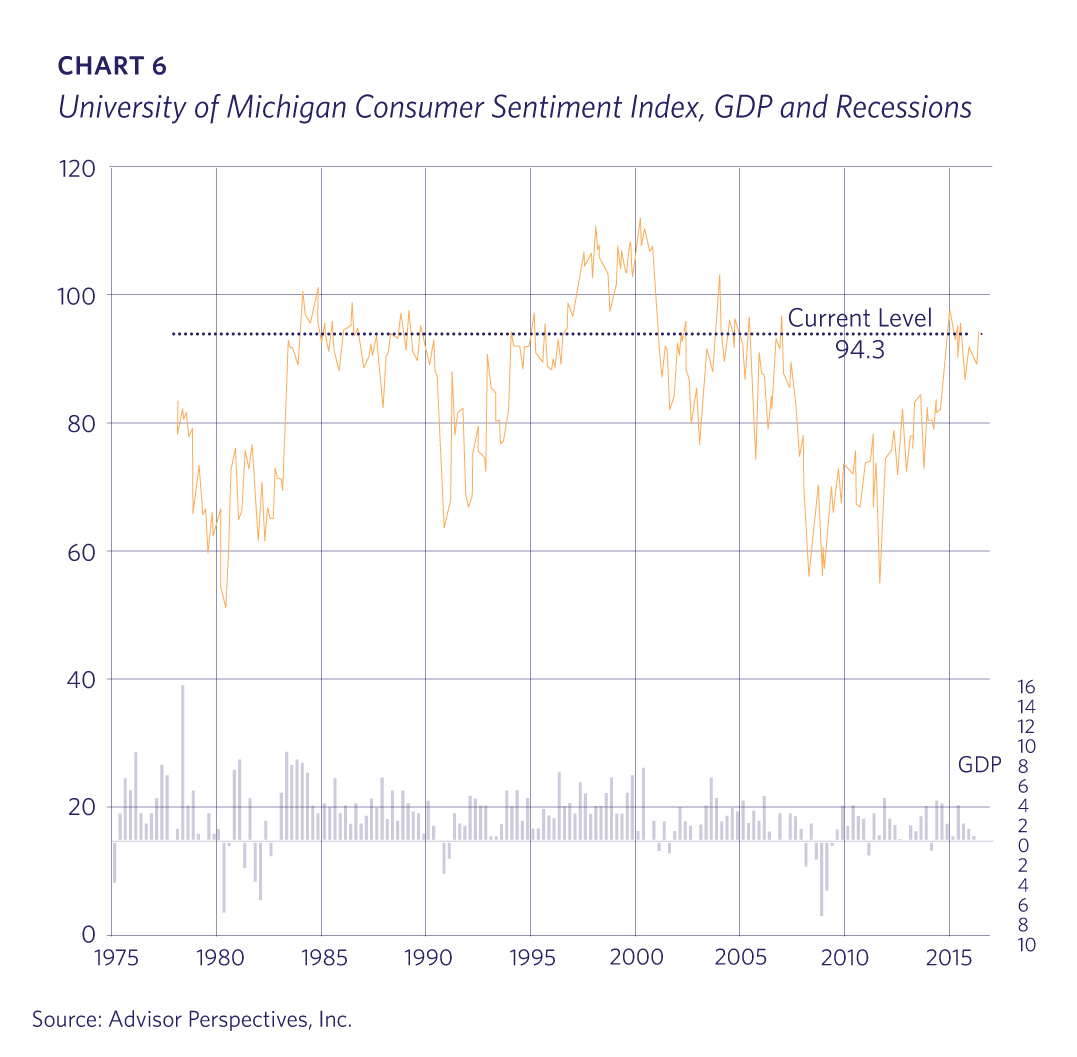
It should therefore not be surprising that consumer sentiment is also at reasonably high levels as reported by the University of Michigan (Chart 6).
Oil Prices and the U.S. Dollar
The above employment and consumer data is solid despite the headwinds since August 2014 created by the retreat of the U.S. energy economy and the strong U.S. dollar. No doubt lower energy prices are a net positive to the U.S. economy, but the impact to energy companies and their employees has been severe. The negative contribution from energy companies’ losses into S&P earnings has resulted in a widely reported “earnings recession” over the past year.
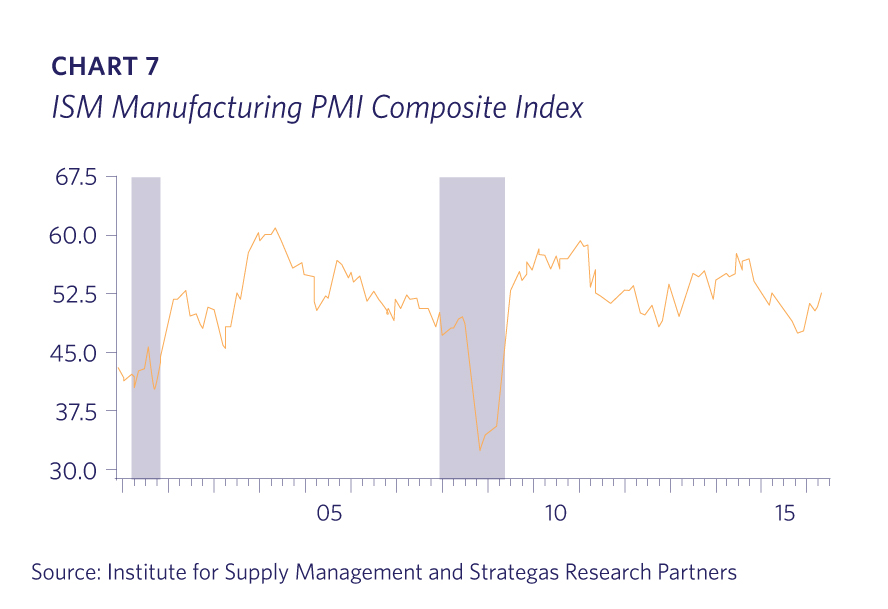
The related rapid rise of 15%-20% in the U.S. dollar from late 2014 has been a huge headwind for multinational corporations, manufacturers and exporters. Indeed, the U.S. manufacturing sector already experienced a mild recession over the last 18 months, but it has stabilized and is again contributing to economic growth (Chart 7).
Despite this double whammy, the U.S. economic expansion has muddled through. Oil prices have rebounded almost 100% from their lows, and the worst is likely over. The U.S. dollar has been weakening in recent months, providing some additional respite.
History shows that there are productive and unproductive bubbles. Productive bubbles such as the railroad, electric utility and telecom excesses eventually burst, but the valuable infrastructure was later leveraged to great effect. U.S. unconventional energy production which resulted in lower fuel costs will ultimately be deemed a productive bubble.
Housing Led by Millennial Household Formation
Housing and household formation by the Millennial generation will be a key factor contributing to economic growth in the upcoming years. Following the housing bubble of the last decade, new construction deservedly plummeted. However, a decade later population growth (there are 25 million more Americans than 10 years ago) and obsolescence necessitates that housing construction accelerate meaningfully from current levels. Residential investment as a percentage of GDP is still near historic lows, and construction should contribute an incremental 0.5% to 1.0% towards GDP for years to come (Chart 8).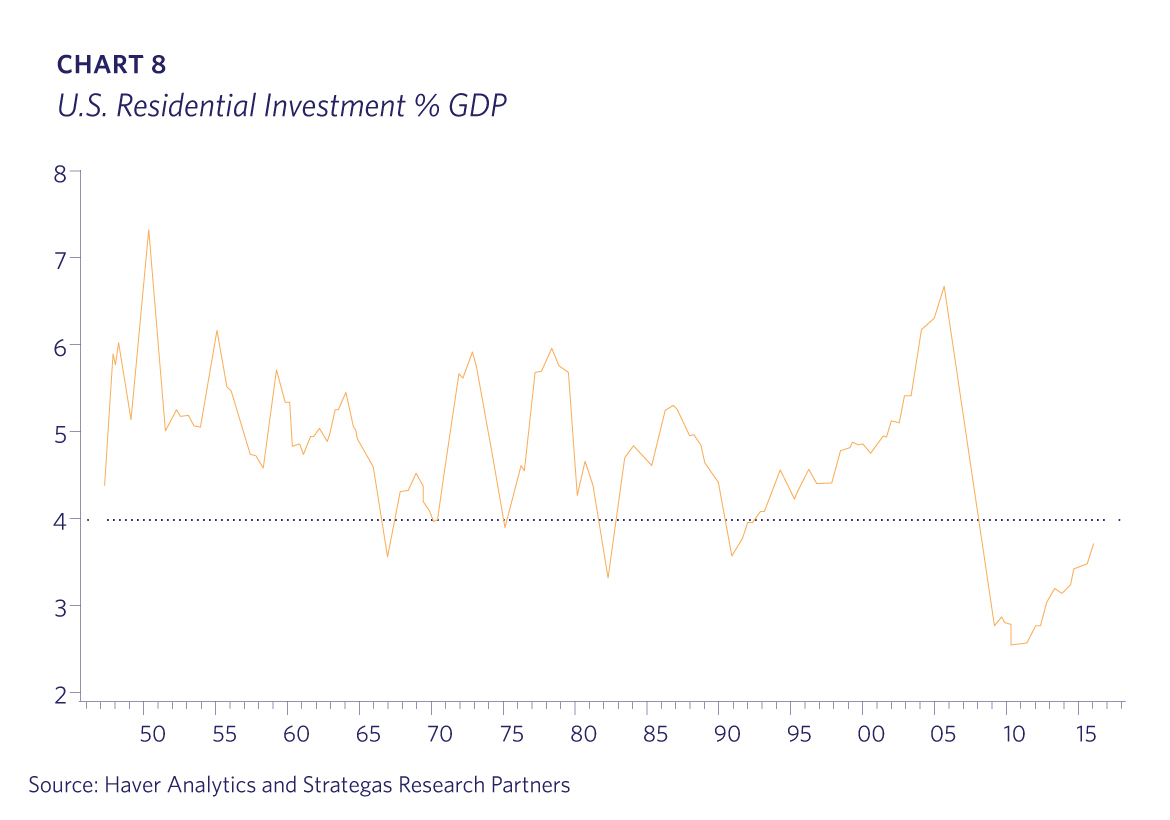
Single-family housing starts are 25% below the 30-year average even before adjusting for population growth. Credit standards are loosening with non- bank lenders offering FHA loans with low FICO scores and minimal down payments. Interest rates remain very low (Chart 9).

The San Francisco Federal Reserve released a report in late May focused on household formation among young adults. The report states that young adult housing participation is at levels last seen in the mid-1990s before the housing bubble inflated. Household formation should average between 1.4-1.5 million per year through 2020. This figure would be up from the average of 900,000 per year for the past five years and the current 1.15 annualized rate today. Even in the 1960s when the working-age population was half the size of what it is now, housing starts averaged 20% higher than today.
Millennial employment increased a strong 2.9% in June versus 1.4% ex-Millennials. Not surprisingly, the Conference Board’s recent consumer confidence survey comparing Americans under 35 versus those 55 and over show Millennials are decidedly more upbeat (Chart 10).

Housing construction, whether for ownership or rental, will accelerate and provide meaningful contribution to U.S. economic growth in upcoming years. We advise that client portfolios have above-average allocations to this theme.
Our base case is that the U.S. economy has more expansion ahead. With growth at such a low level, there could always be a technical recession with minimal GDP declines for two consecutive quarters, but the underlying restraint thus far since the Financial Crisis provides fuel for continued growth for some time. However, there are several secular factors that we cannot ignore and must be incorporated into our investment thinking and portfolio positioning.
End of the Debt Super-Cycle?
The current trajectory indicates that we are approaching the end of the debt super-cycle, a term used to describe the slowly increasing debt levels of the developed world since World War II. Accumulated debt has migrated from consumers, corporates and banks to the sovereign entities from which there is nowhere else to go; debts must be repaid or defaulted upon at some point. These debts might be repaid by some in less valuable, inflated currencies. The culmination of this 70-year trend could be months or decades away. Its resolution has implications for all investors and indeed all participants in the economy.
Demographic Challenges
Meanwhile the developed economies’ populations are aging and accumulated obligations are being shouldered by fewer workers. Since the Financial Crisis, there has been a pronounced drop in productivity for reasons not fully understood. Since economic growth is simply population growth multiplied by productivity, GDP has dropped from prior eras. Any anti- trade, anti-immigration policy changes will not improve productivity trends.
Economic Insecurity
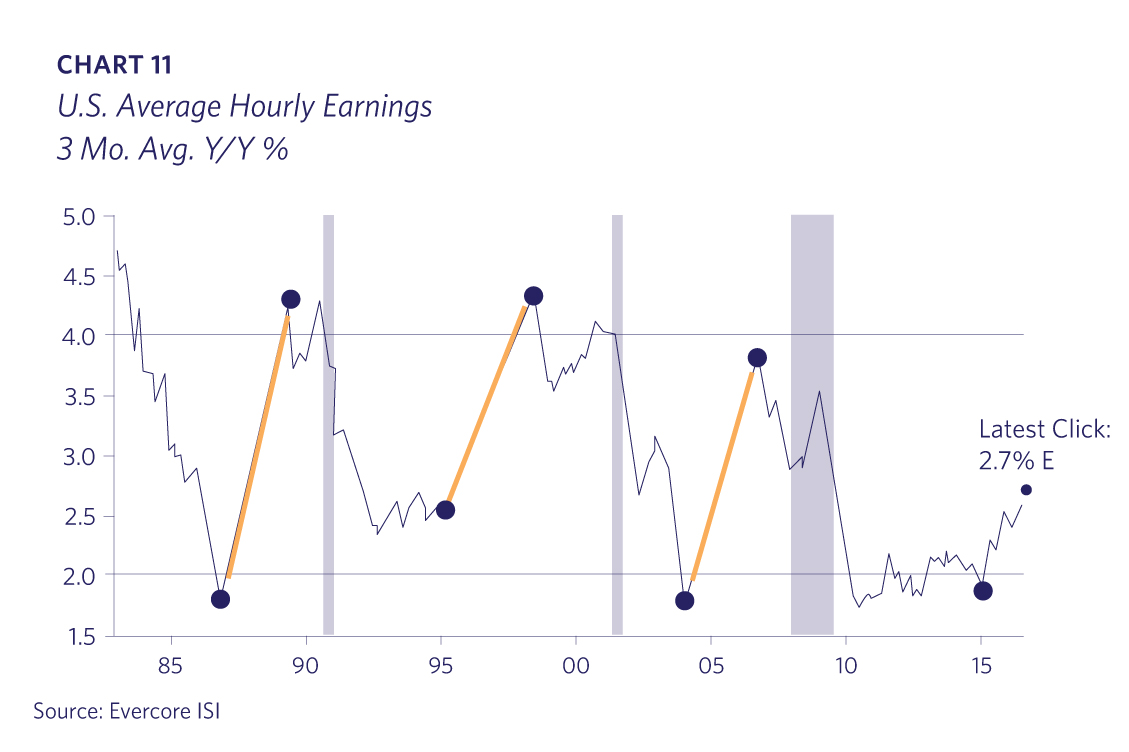
Technology and globalization have been moving middle and lower income jobs out of the developed world for decades. The playbook for many U.S. and developed world corporations has been to keep the marketing, management, and innovation functions at home while moving the more volatile, lower margin production or manufacturing functions abroad. While this allows companies to capture higher margins and sell goods for lower prices, it has economic and social repercussions at home. Technology is now increasingly displacing more white- collar workers. There is a major skill mismatch between job openings and available workers. This mismatch explains why companies are firing fewer employees, yet there continues to be so many job openings. The notable lag in workers’ earnings this cycle from previous cycles is a symptom of this underlying problem (Chart 11).
Lack of Structural Reform
While the U.S. has not adequately addressed many issues, the lack of structural reform in Europe and Japan since the Financial Crisis is appalling. Unemployment in Spain is 20% and over 10% in Italy and France. Youth unemployment for persons under 25 is almost 50% in Spain and over 40% in Italy; it is over 20% in France and Ireland. Because these economies do not have the structural flexibility of the U.S., the impact on the lower and middle income demographic is even more acute. For example, an employer must pay a worker two years’ severance in France, thereby strongly discouraging companies from hiring in the first place.
Political Polarization and Dysfunction
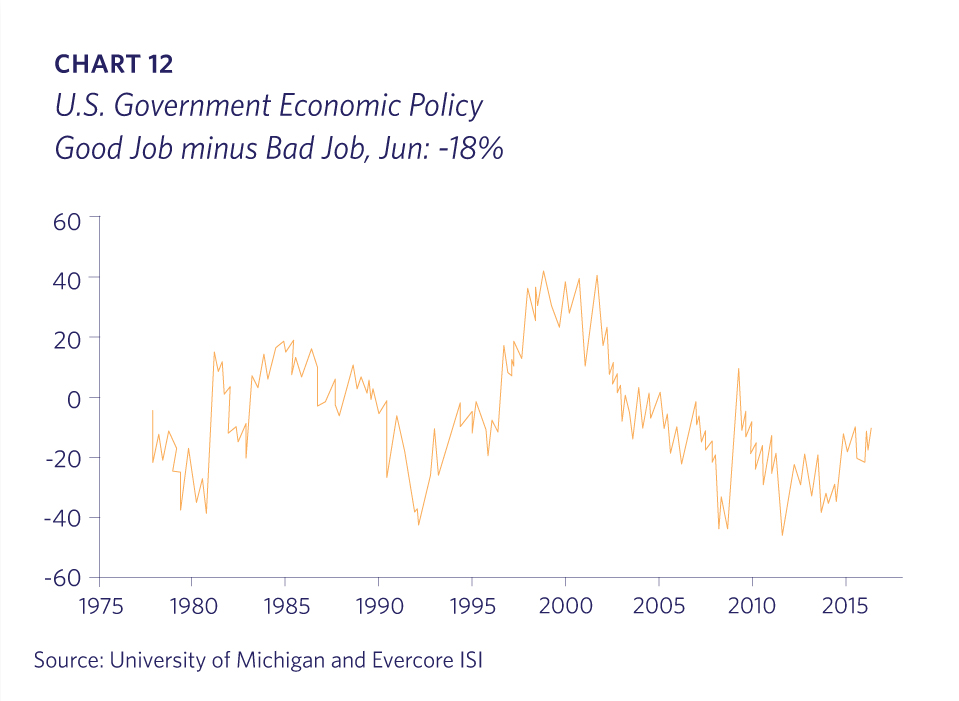
Slow economic growth, vested interests, fragmented media and in some cases gerrymandered election districts have resulted in polarized political systems with little common agreement. The phrase “you are entitled to your opinion, but not your own facts” is increasingly proven untrue. Satisfaction in U.S. government policy is at very low levels as illustrated by this University of Michigan survey (Chart 12).
Those who feel economic pain and insecurity are finding their political voices. Populist politicians across the political spectrum are emerging and capitalizing on this anger and frustration. It is very possible we are seeing a fundamental reordering of the multi-decade political and economic order. The implications could be positive at a future date, but the changes will certainly be disruptive and volatile. The BREXIT referendum, determining whether Britain will remain in the European Union, is a very obvious recent example.
Monetary Policy and Central Bank Activity
Polarized politics have resulted in little substantive improvement in addressing most of the issues that led to the Financial Crisis. The major Central Banks, such as the Federal Reserve, Bank of Japan (BOJ) and European Central Bank (ECB), have taken on the bulk of trying to stimulate economic growth. After successfully employing emergency measures in 2008-2009 to blunt the collapse, they have engaged in unprecedented policy to keep interest rates low, depreciate their currencies to make exports more competitive and try to promote investment. However, it is becoming increasingly apparent that raising and lowering interest rates at a measured pace to cool and stimulate economic activity is no longer a sufficient tool to manage these complex systems.
The Central Banking dogma in recent decades is that negative real interest rates (reducing rates below the rate of inflation) will encourage risk-taking and therefore economic growth. For example, when inflation is 4%, reducing the short-term rate to 3% results in a (1%) real rate. The logic is that lower rates alleviate borrowers’ debt burdens and stimulates new investment as money is inexpensive. This monetary policy is controversial, but has been accepted central bank doctrine for several decades.
As an emergency measure in late 2008, the Federal Reserve introduced a new policy called Quantitative Easing which initially involved purchasing long-term government debt securities. By reducing the supply of long maturity bonds, there is a scarcity for private investors who need long duration assets to offset liabilities, such as pension funds and insurance companies; long-term rates would be expected to drop as a result. Quantitative Easing has been adopted by the other major central banks and in some cases the asset purchases have expanded to corporate securities and even stock ETFs in Japan. We now have public funds buying private assets in some jurisdictions.
Since inflation has been negligible to non-existent in much of the developed economies post-2008, creating negative real interest rates is this environment was viewed to be impossible. However, the Bank of Japan, European Central Bank and others have introduced negative nominal rates, also known as Negative Interest Rate Policy (NIRP). In addition to hopefully achieving negative real rates, there is also the objective of weakening their currency. Institutional currency trading can be heavily influenced by relative short-term rates. A weaker currency helps exports but is a zero sum game as it robs the stronger currency exporter.
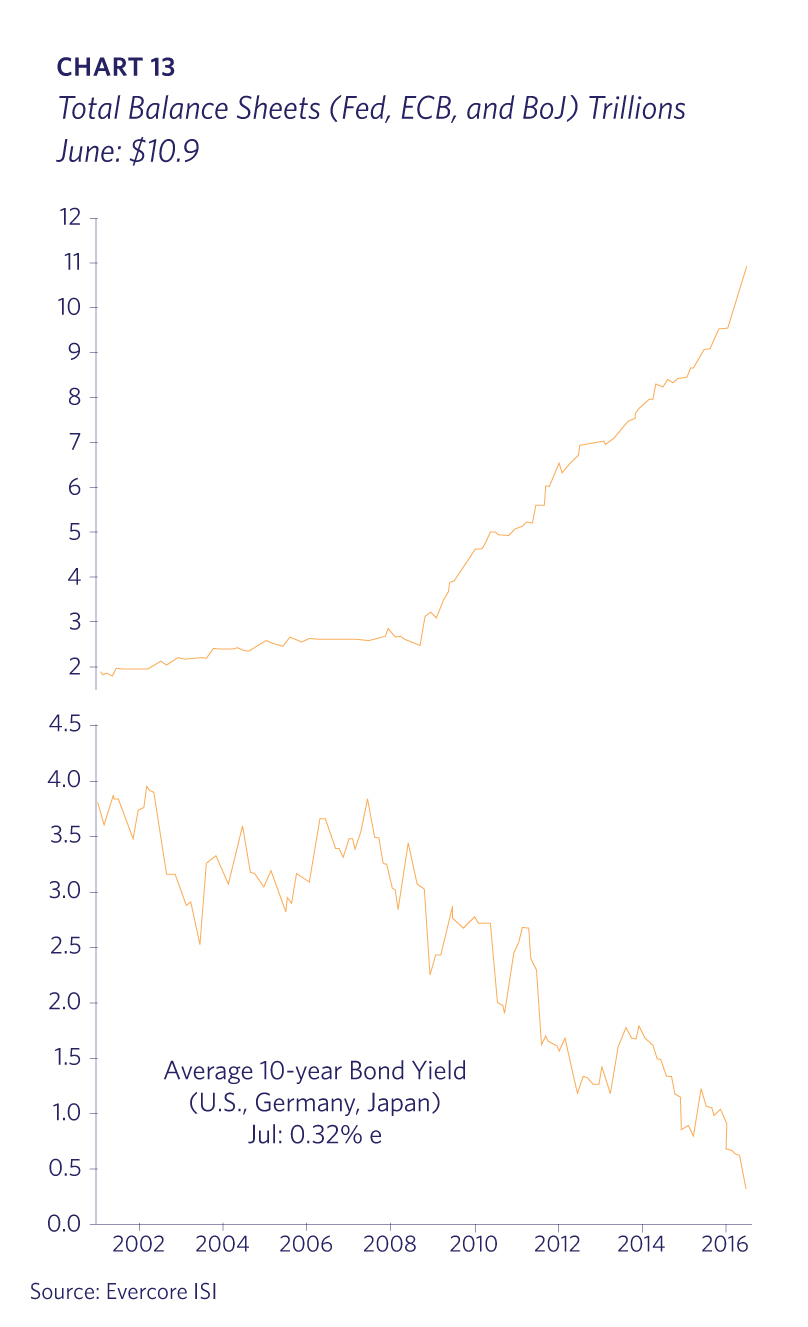
The combination of Quantitative Easing and NIRP has driven rates to unprecedented low levels. The concurrent expansion of the three largest Central Bank balance sheets accompanied with the large drop in 10-year government bond yields is not a coincidence (Chart 13).
As of July 2016 almost $13 trillion in government bonds have negative interest rates – meaning that investors actually pay the government for the right to lend it money. Only $2.2 trillion or 6% of the $35 trillion in global government debt now yields more than 2% as reported in Barron’s. While intended to stimulate consumer or business demand, these policies have instead resulted in a tax on banks and a depression in bank stocks in Europe and Japan. It is also likely that negative real interest rates encourage financial speculation and telegraph economic insecurity, which hinders investment. Low interest rates are not sufficiently compelling for a business to hire workers or build a new factory in Continental Europe or Japan. There is little to no private sector loan demand in Europe or Japan.
Negative interest rates represent the single greatest source of uncertainty we see in the world today. It is hard to envision how this scenario will play out, but it seems probable that it will be a source of future economic and market volatility. For this reason in particular we feel that it is prudent to maintain more conservative portfolios than usual at this time. While our equity allocation is heavily tilted to domestic companies that benefit from the relative strength of the U.S. expansion, we are using other asset classes to diversify and hopefully smooth out future volatility as a result of the potential threats outlined above.
Investment Sectors
U.S. Stocks
U.S. equities have had a bumpy and unsatisfying 2016. The bull market continues to be met with apathy or hostility, undoubtedly a result of the secular issues outlined previously. In early July the S&P 500 hit an all-time high. This was its first high in 285 trading days, which is a long time to pause during a bull market. From a technical perspective, establishing a new high after a long delay is a bullish sign.
The popular narrative is that the only thing propping up the stock market is the Federal Reserve. While that is a factor, valuations are near historical averages at a time when bond yields are historically low. Over 60% of the stocks in the S&P 500 pay a dividend higher than the income generated by owning 10-year U.S. Treasury (Chart 14).
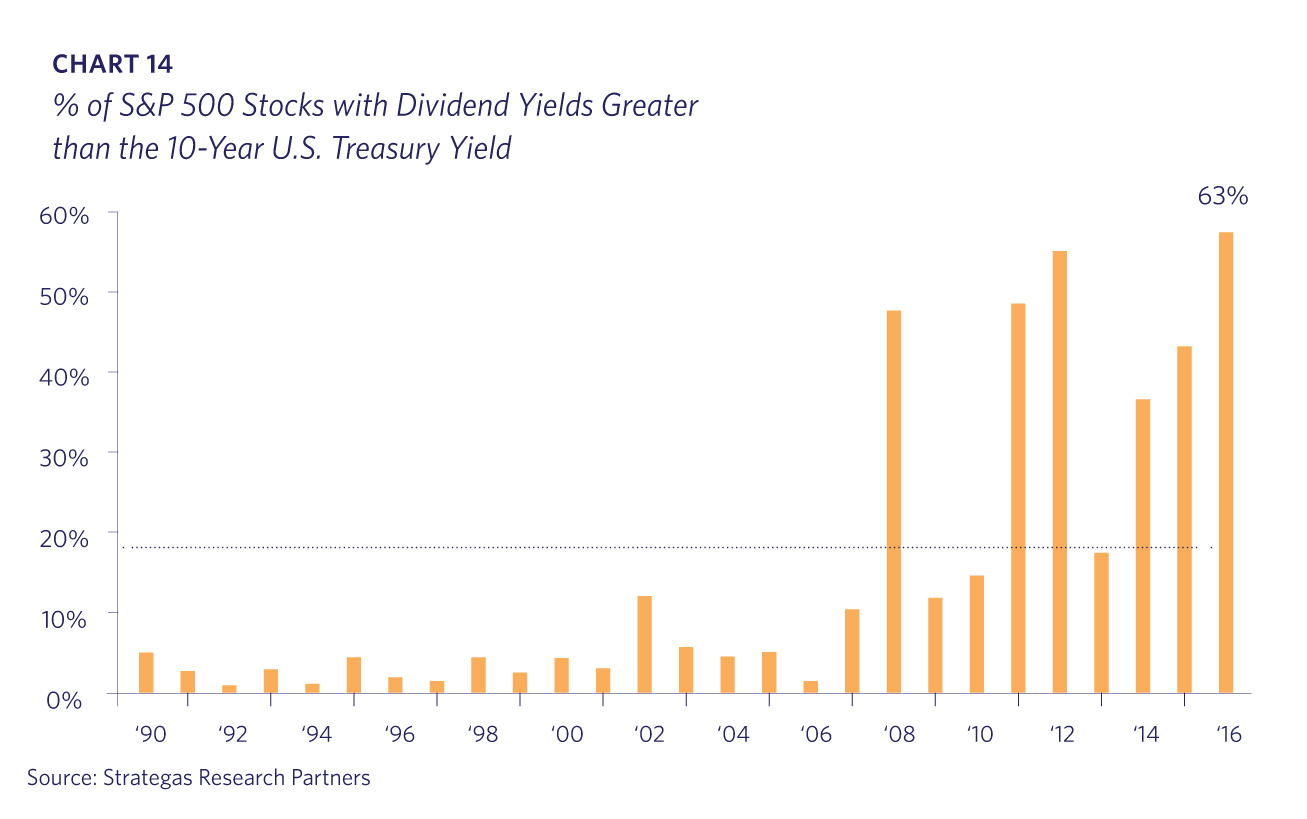
Barron’s May 30 edition analyzed the 1,400 U.S. dividend paying companies from July 2007 versus today. In 2007 the average dividend yield was 2.9% when the 30-year U.S. Treasury bond yield was 5.1%. Today dividend yields are 3.2% but the 30-year Treasury is under 2.2%.
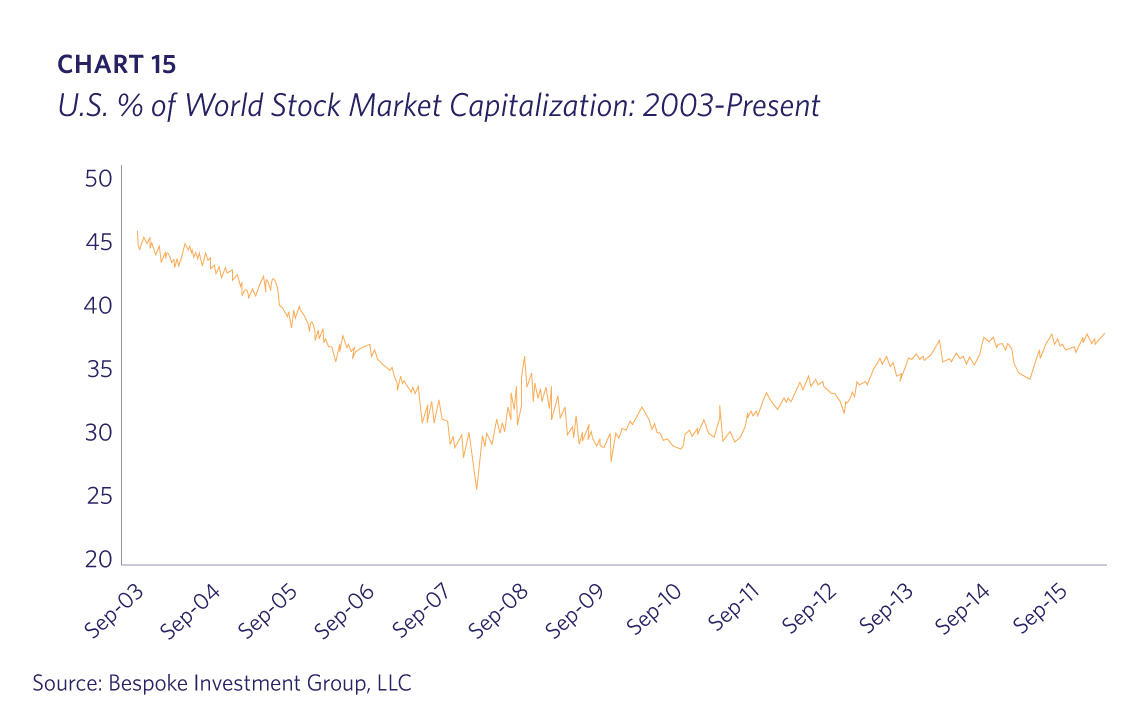
The U.S. stock market has recently outperformed the rest of the world, increasing its share of world stock market capitalization. The excitement of the BRICs and the Euro project led to a drop of over 15% during the last decade. The U.S. has clawed back almost half of this drop over the past five years and we expect this trend to continue (Chart 15).
Most of the best management teams and companies are U.S. domiciled. Most innovation still happens in the U.S., frequently driven by ambitious entrepreneurs who have moved here from overseas. Investment professionals are seldom congratulated for the investment mistakes they avoided, but focusing primarily on U.S. equity markets in recent years has been a good decision; avoiding Europe and Japan was an even better one.
With promiscuous monetary policy and an elongated economic expansion, we expect U.S. stocks to continue to churn higher over the coming years. For most investors, U.S. equities should continue to be their largest asset class.
Fixed Income
As noted earlier, the amount of global sovereign debt with negative yields is almost $13 trillion. The Bank of Japan owns roughly a third of its own government debt. The European Central Bank has expanded its purchases to include corporate bonds – up to $5-11 billion/month – in a market that totals $650 billion, per the Wall Street Journal. The resulting reduced liquidity and sub-zero yields make U.S. bonds look relatively cheap, attracting heavy inflows of foreign dollars. This has continued to put downward pressure on U.S. yields.
Last December, the Fed raised rates by a quarter of a percent, and signaled three more hikes. Those subsequent increases have been delayed due to global uncertainty as well as choppy economic and employment growth in the U.S. When and whether they resume, longer rates are likely to remain stubbornly low.
Fundamentally, there exists the risk of rising rates over a medium to longer-term horizon. More immediate, there is a significant likelihood that government bonds won’t yield enough to compensate for even modest rates of inflation.
Lyell views fixed income as an important asset class in most client portfolios. We employ a diversified approach, including callable corporates, mortgage-backed securities and convertible bonds. We also view select alternative assets as fixed income surrogates, such as equities with growing dividend yields, real estate, managed futures and gold.
Commodities, Oil and Gold
Much of the commodity complex has enjoyed a rebound from fire-sale prices early in the year. The worst fears of economic implosion did not materialize, and the weakening U.S. dollar has led to strong price moves. However, given continued tepid global growth and ongoing excess capacity, we are cautious on most industrial commodities such as iron ore or copper.
The most important industrial commodity, oil, rebounded almost 100% from its early 2016 lows. Oil demand has been consistently under-estimated by the International Energy Agency (IEA) in recent years due to poor data collection in developing countries such as India and China; by the way, the greatest incremental demand comes from these countries. Michael Rothman from Cornerstone Analytics has been tracking this “missing oil” throughout the recent oil price collapse and has predicted that the IEA would eventually reclassify the “missing oil” as increased demand. This is in fact exactly what is happening, though the story remains largely unreported. Global oil demand continues to be undercounted which provides continued support for energy prices.
Precious metals, such as gold and silver, have performed very well with gold +28% and silver +45% on a year-to-date basis. Central Bank experimentation creates an environment conducive to seeking other stores in value beyond those in fiat currencies. This narrative is not likely to change soon and some precious metals have broken their multi-year downtrends. We believe that a small portfolio allocation to precious metals as a hedge and diversifier makes sense for many investors.
Real Estate
U.S. residential real estate prices continue to increase with the National Association of Realtors (NAR) reporting median prices up 6.3% from one year ago. Distressed sales are now only 7% of all sales, down from 10% one year ago and the peak of 32% in January 2009. In inflation-adjusted terms, the S&P/Case- Shiller index is still 20% below the 2006 peak. Low interest expenses translate into better affordability. Combined with lagging single-family supply, national home prices look solid.
Multi-family
The demand for housing in key markets such as San Francisco and New York has been met by substantial new supply in Class A apartments in recent years. Rents in many Tier 1 markets are finally plateauing after several years of strong growth.
A combination of factors, including high zoning and land costs, has resulted in a predominant focus on Class A multi-family construction for many years. There has been essentially no new supply for Class B and C apartments since 2002 per Reis Inc., excluding rent-regulated units; rents have been increasing as a result of chronic undersupply. Select investments in Class B or even C apartments could be attractive, even at this stage of the economic cycle.
Office
Office vacancy rates have moved down slowly this economic cycle, but remain significantly higher than in the late 1990s, primarily due to the way that employees engage with work. Mobility, flex-time, office sharing, etc. are all trends that seem to reflect the new reality. Although there are certainly exceptions for well-located buildings, we would be cautious investing in office properties moving forward.
The Election
We aren’t going to ignore the U.S. Presidential election. We have two candidates with the highest unfavorable ratings in history, and they are running against each other. In addition, both the House and the Senate could see a significant re- shuffling. While we do not know how all of this will play out, it is a certainty that we will all be hearing about it ad nauseam until the outcome is decided. Investment markets do not like uncertainty, so some volatility is to be expected over the next several months. We are positioning client portfolios to handle this volatility while benefiting from the continued strength in key sectors of the economy.