October 4, 2016
DOWNLOAD PERSPECTIVE
We are fielding many questions regarding how we are positioning portfolios in anticipation of the presidential election. The stock market has thus far taken the upcoming event in stride through what is typically its most volatile season. Is it the market’s confidence in the status quo, the constraints on executive power, or the perception that presidents have, at best, a muted impact on the economy? Keep in mind that in 2012 the S&P 500 steamed steadily upwards and gained 16% despite what would have appeared to be major policy differences between President Obama and Mitt Romney. Investors who sold risk assets in early 2012 and waited for political clarity were no doubt disappointed in this decision.
Market volatility is one of life’s certainties along with death and taxes. You don’t know what might be the cause of a sudden market drop – it could be a technology glitch on a stock exchange, a military surprise, or an unanticipated or unwanted political outcome. Portfolios should be configured for each client in anticipation of seriously unpleasant future volatility; adequate liquidity should be available to weather the turbulence. Investments that dampen risk are crucially important for most portfolios. For some clients, cash should be set aside to provide liquidity, comfort and peace of mind.
It is Lyell’s view that people tend to overestimate a president’s impact on the economy and markets. The primary factors that affect stock markets are liquidity and economic fundamentals. The U.S. economy continues to expand. In August 2014 the U.S. dollar surged and oil prices collapsed which punished the energy and export sectors. By January 2016, the average U.S. stock, as represented by the S&P 1500, was down almost 27% from its 52-week high. Perhaps we already had the “bear market” in 2014-2015? A case could be made that although the U.S. averted a recession on a technical level, the economy was re-set and we are “early cycle” again. Globalization and technology continue to impact U.S. citizens in economically divergent ways. However, the stock market values publicly-traded companies, not citizens. Most of the great companies in the world trade on U.S. stock exchanges, and these companies leverage globalization and technology to great effect.
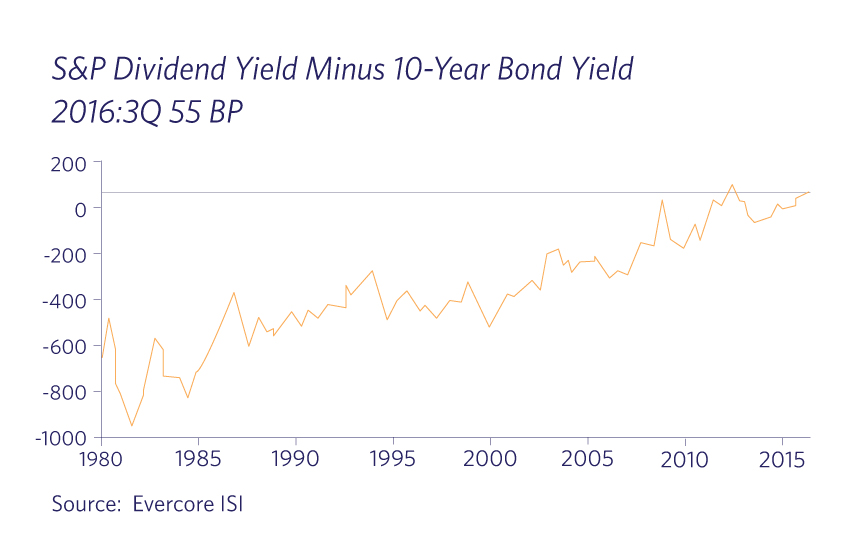
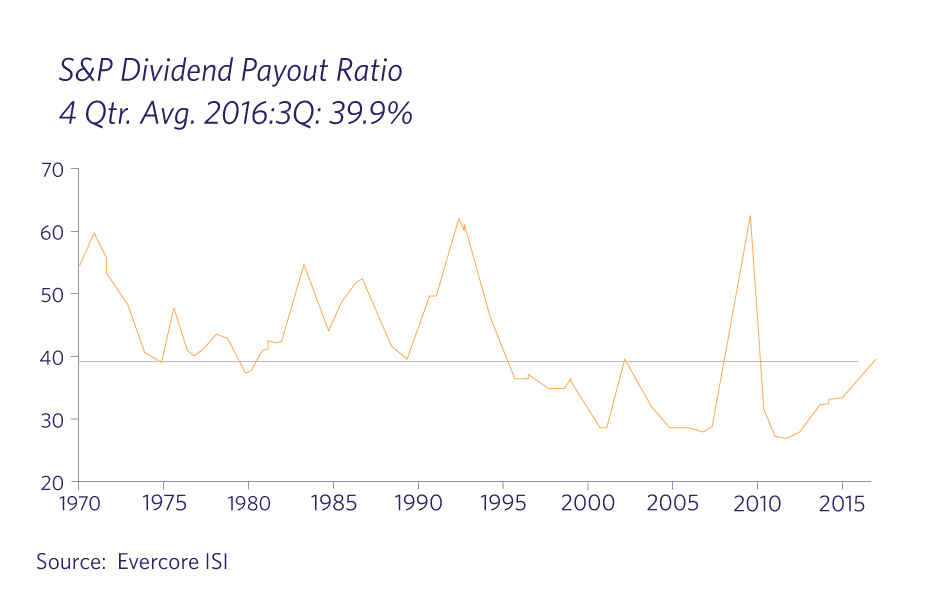
In terms of liquidity, the major central banks are engaged in unprecedented monetary aggressiveness. Stock valuations are affected by this wave of liquidity. The 10-year U.S. Treasury bond yields 1.6%, while the S&P 500 yields 2.1%; this inverse relationship between dividends and yields hasn’t occurred since the 1950s and is radically different than in recent decades. Meanwhile, dividend payout ratios (the percentage of earnings that companies distribute in dividends) are nearing modern historical averages but could have significant further room to increase. The fact that companies with high dividends are being rewarded by the stock market is not likely missed by corporate executives. S&P 500 dividends increased 5.2% year-over-year for the 3rd quarter of 2016.
U.S. stock valuations are trading at a premium to their historic valuations, but not by much. The S&P 500 is trading at a forward price/earnings multiple of 17x. With interest rates so low, bond “P/E’s” are at all-time highs with the 10-year Treasury sporting a 62x P/E. So on a relative basis, stocks are cheap compared to bonds. Stocks would remain inexpensive even if yields increased across the curve by 1-2%.
In addition to economic fundamentals and liquidity, Lyell is focusing on the stock market’s breadth and its trend. The number of stocks advancing versus declining (its breadth) is much healthier than it has been for a couple years. The equal-weighted S&P index is outperforming the market-cap weighted index in most sectors for the first time in several years. The average stock is starting to play catch-up, signifying a stronger market below the headlines.
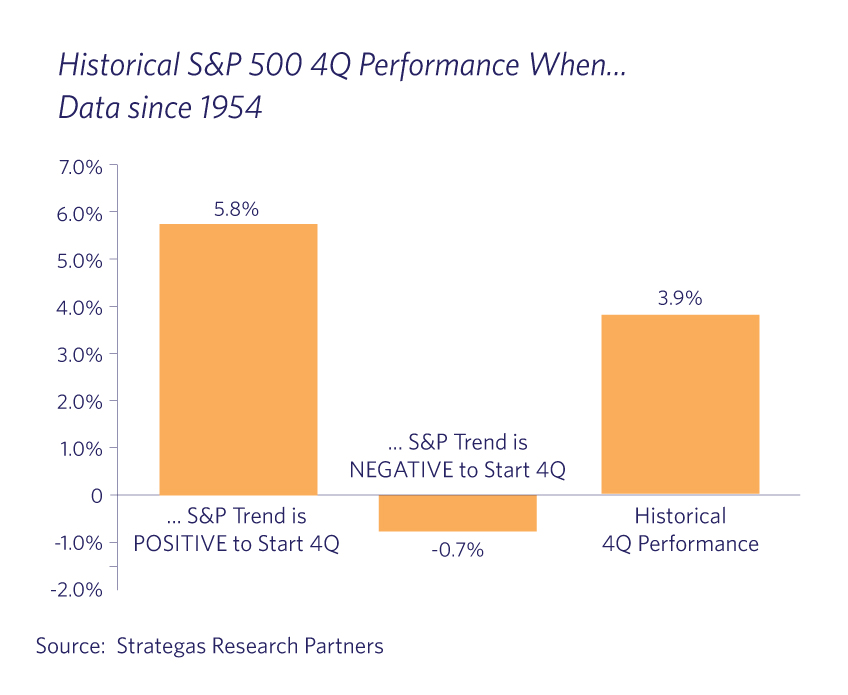
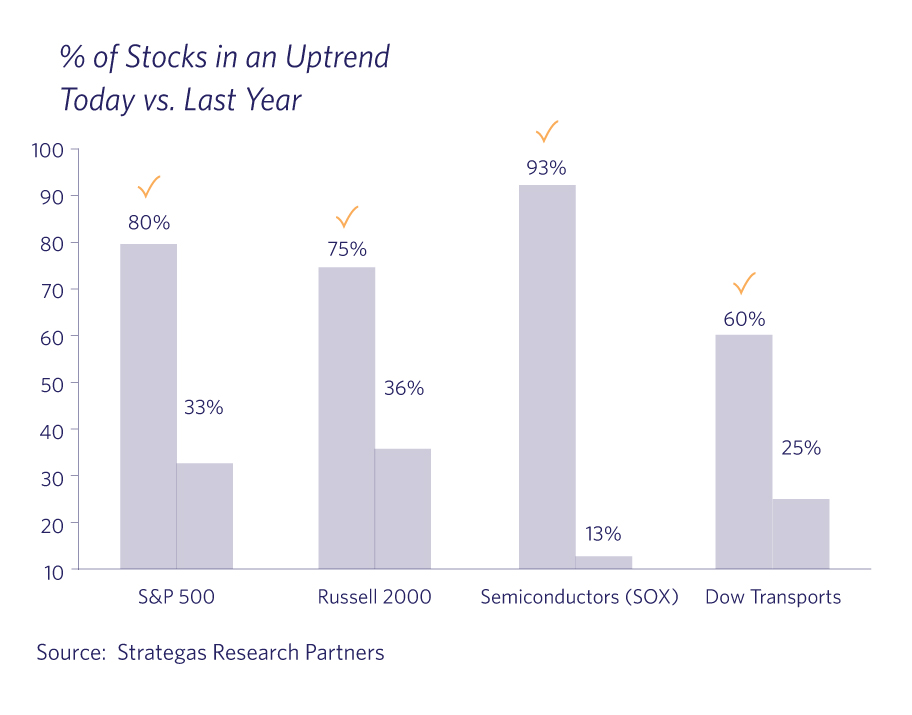
Just as importantly, the number of U.S. stocks in an uptrend is much higher than it was a year ago. The chart below illustrates the percentage of stocks in uptrends within key indices today versus last year at this time. Whereas September and early October represent the stock markets’ historically most vulnerable period in terms of seasonality, the 4th quarter is typically its strongest. When reviewing historical precedence it is worth noting that trend usually predicts Q4 performance. Using data compiled since 1954, the S&P 500 has traded higher during the 4th quarter in 88% of the instances when the quarter began with the market in an uptrend such as it is today.
So to the question of what are we doing in anticipation of this election? Nothing different. Although much has been made of the policy positions and public comments of the two candidates, we remind ourselves that campaign promises are often not delivered upon. In addition, this election is unlikely to be a “sweep election” whereby one party wins the presidency and both houses of Congress – and so the new president will have some constraints regardless of the outcome. Based on our current read of the landscape and the above factors, we would view any pre- or post-election stock market drop as a buying opportunity.